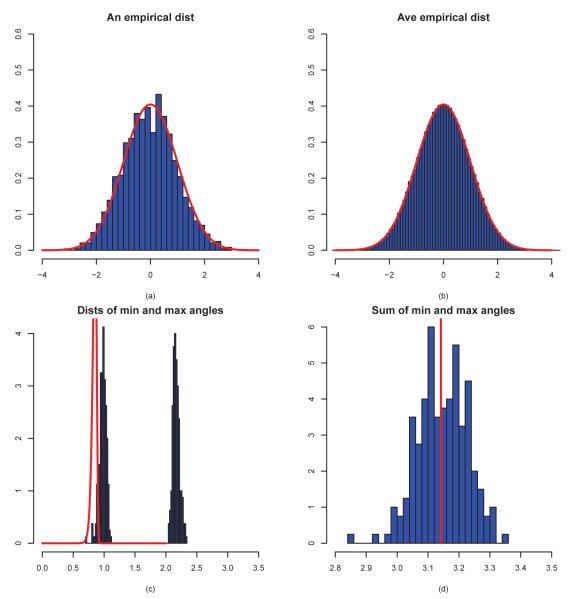
Figure 4.
Various distributions for p = 30 and n = 50 based on 200 simulations. (a) A realization of the normalized empirical distribution μn,p given by (2); (b) The average distribution of 200 realizations of μn,p; (c) the distribution of Θmin and its asymptotic distribution; (d) the distribution of Θmin + Θmax; the vertical line indicating the location π.

