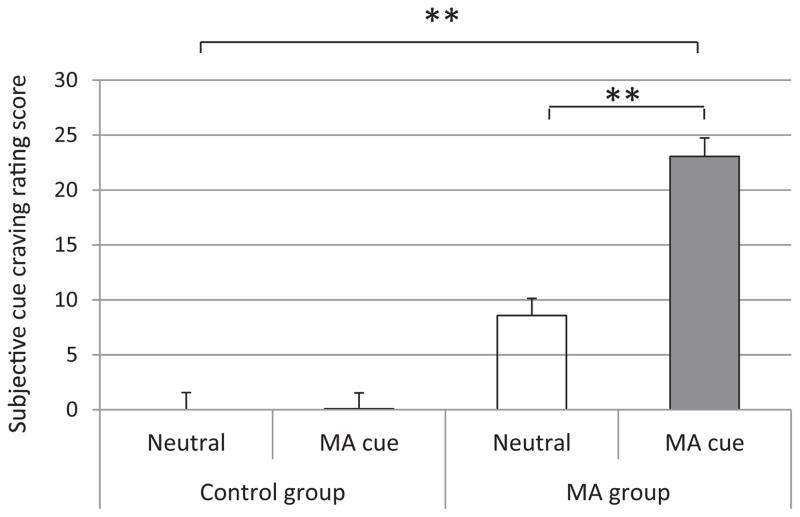
Fig. 2.
Comparisons of cue-induced craving rating between neutral cue and MA cue in the healthy control group and the MA dependent user group on baseline assessment. Mixed model analysis of variance revealed a significant main group (control vs. MA) effect (p < 0.0001) and a significant main cue exposure effect (p < 0.00001). Post hoc t test showed that MA cue exposure induced significant higher subjective cue craving ratings (p < 0.001), while no significant difference was found between neutral and MA cue in control group (p = 0.29). Mean ± SEM; *p < 0.05, **p < 0.01.

