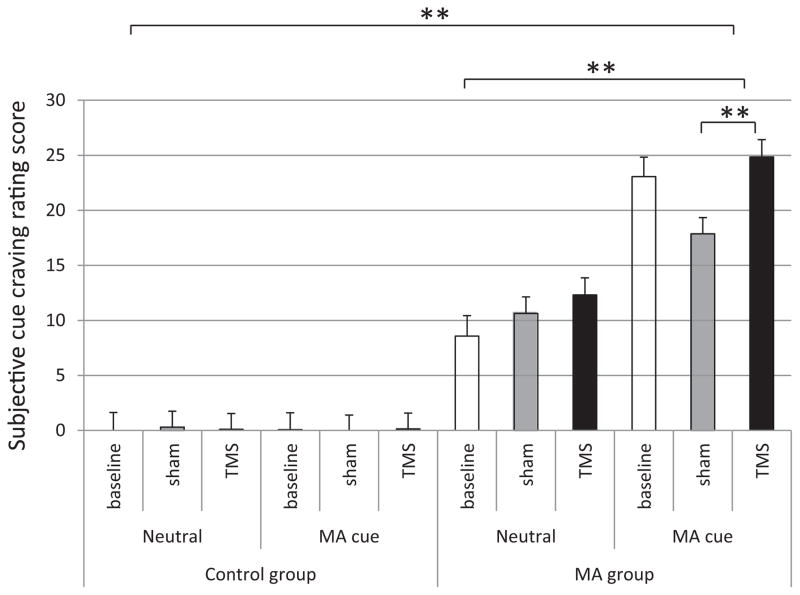
Fig. 3.
Comparisons of cue-induced craving rating between TMS and sham; neutral cue and MA cue; control group and the MA group. Mixed model analysis of variance showed that the cue craving of MA group was significant higher than control group (p < 0.0000001); MA cue craving was significant higher than neutral cue (p < 0.000001). Although main effect of treatment was not significant (p = 0.14), post hoc results showed that the cue craving during TMS was significant higher than that during sham stimulation (7.93 vs. 9.36, p = 0.04). Further, post hoc analysis did not show a significant difference of cue craving between real and sham TMS in healthy controls, while the post hoc results of MA group showed that real TMS induced significantly cue craving than sham TMS (17.86 ± 1.46 vs. 24.85 ± 1.57, p = 0.001). Mean ± SEM; *p < 0.05, **p < 0.01.

