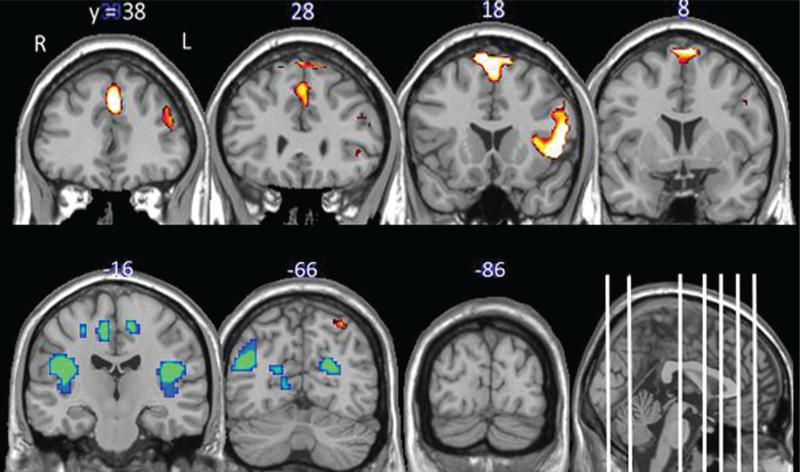
FIGURE 2.
Brain response to “resisting” appetitive food cues. The data in this figure include the statistical maps of the brain regions significantly activated when viewing food cues relative to non-food cues when the participants were instructed to “Resist” the cues. Brain regions with elevated activity to the food cues (red color map) and depressed activity to the food cues (blue color map) relative to neutral are displayed (cluster-wise P < 0.05, uncorrected). The coordinates above the coronal slices refer to the anterior–posterior dimension of the standardized MNI template. They are displayed as white lines on the sagittal section for further reference. R = right hemisphere, L = left hemisphere.

