Fig. 3.
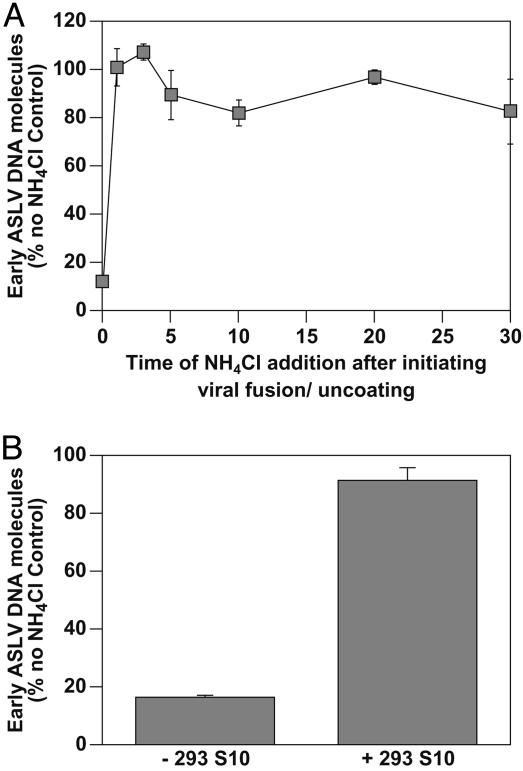
The 293 S10 factor(s) act after completion of low pH-dependent fusion. (A) ASLV Env-dependent fusion occurs immediately after removal of the NH4Cl-imposed block. 293(TVA800) cells were challenged with RCASBP(A)-EGFP at an estimated MOI of 0.4 EGFP transducing unit. Cell-free ASLV fusion/uncoating reactions were then set up with 150 μg of 293 S10 fraction and 3 mM NH4Cl, and fusion was initiated by temperature shift from 4°C to 37°C. At different time points, the concentration of NH4Cl was increased to 63 mM to block any further virus–cell membrane fusion. ASLV early viral DNA products were then measured by real-time PCR amplification as described in Fig. 1B. The results are shown relative to those obtained from a parallel sample that was allowed to proceed to completion after the initiation of fusion (defined here as 100%). A representative example of an experiment that was performed twice, each time in triplicate, is shown, with the standard deviation of the data indicated with error bars. (B) The 293 S10 factor(s) act after low pH-dependent membrane fusion has been completed. 293(TVA800) cells were challenged with RCASBP(A)-EGFP at an estimated MOI of 0.08 EGFP transducing unit, and an ASLV cell-free fusion/uncoating reaction was set up with 3 mM NH4Cl and without the 293 S10 fraction. Fusion was induced for 1 min by shifting the samples to 37°C, and then NH4Cl was added to a final concentration of 63 mM to block any further fusion. Samples were then incubated with or without a 150-μg aliquot of the 293 S10 fraction for an additional 6 h at 37°C before early viral DNA products were measured by real-time PCR amplification. The results are shown relative to those obtained from a control sample that had the 293 S10 fraction added before induction of fusion and was maintained under fusion-permissive conditions (3 mM NH4Cl) (defined here as 100%). A representative example of an experiment that was performed three times, each time in triplicate, is shown, with the standard deviation of the data indicated with error bars.

