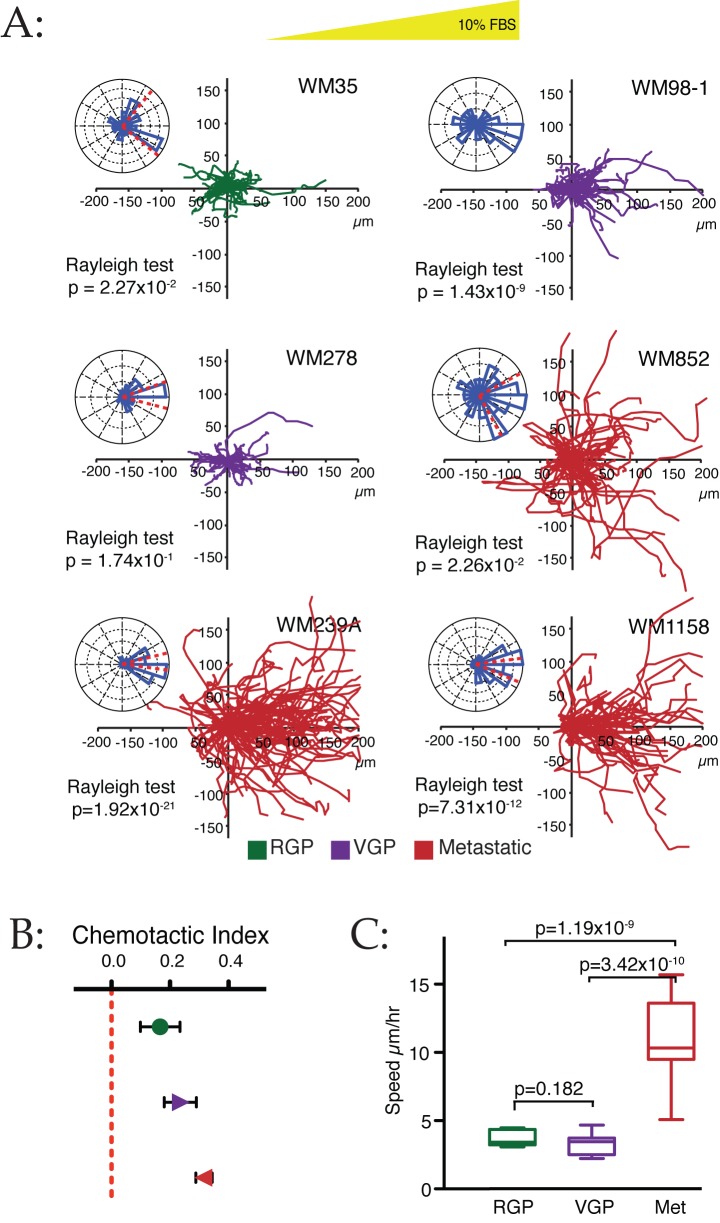
Figure 3. Chemotaxis of cells from different melanoma stages.
(A) Chemotaxis of a panel of six cell lines from different melanoma stages (RGP, green; VGP, purple; metastatic, red) up a 0%–10% FBS gradient was measured as above (n≥45 cells per cell line). (B) Chemotactic index of cells from different stages. Data from (A) were collated by melanoma stage. Chemotaxis improves as the stage of melanoma progresses, although even the earliest RGP cells show clear chemotaxis. (C) Speeds of cells from different stages. Data from (A) were collated by melanoma stage. Metastatic lines are conspicuously faster (p-values from unpaired t-tests), although again the speed of RGP and VGP cells is still relatively high for non-haematopoietic cells.

