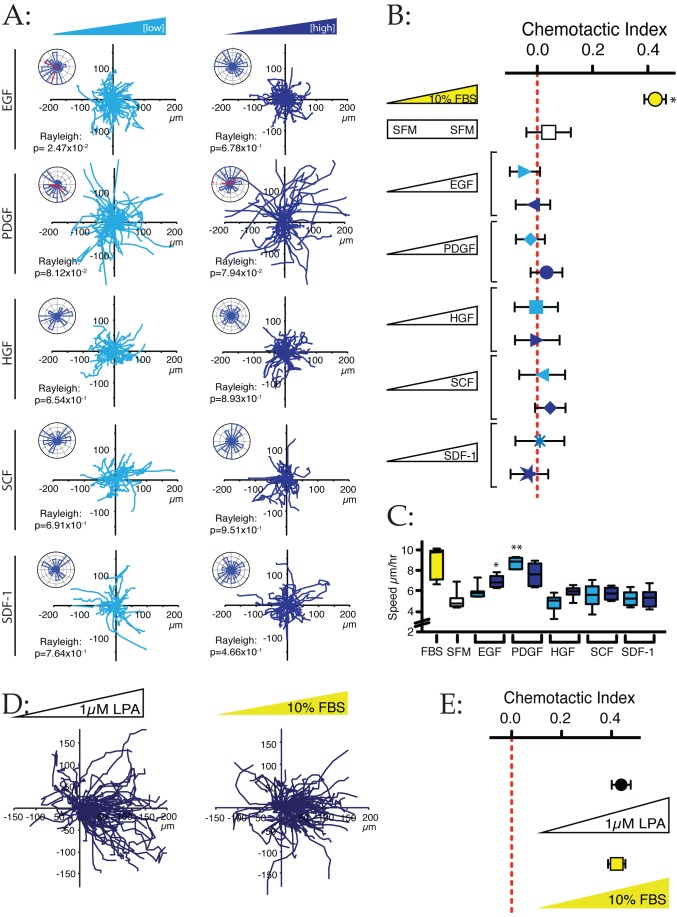
Figure 4. Identification of LPA, rather than growth factors, as the principal attractant in serum.
(A) WM239A cells were exposed to gradients of low (light) and high (dark) concentrations of several growth factors and the chemokine SDF-1 in combination with SFM. Spider and Rose plots with Rayleigh tests are shown (n>40 cells for each condition). Concentrations tested were EGF (6.25 and 25 ng/ml), PDGF (25 and 100 ng/ml), HGF (10 and 30 ng/ml), SCF (10 and 100 ng/ml), and SDF-1 (100 and 300 ng/ml). None shows obvious chemotaxis. (B) Quantification of data from (A). Serum gradients promote strong chemotaxis (p<0.0001, unpaired t-test), but gradients of all growth factors tested show no significant chemotactic index (p≥0.40). (C) Growth factors enhance cell speed. Data quantitated from the cells in Figure 3A. Directionless cell speed was measured by totalling the distance moved between time points. EGF and PDGF stimulate cells in serum-free minimal medium to speeds comparable with serum gradients. Single asterisk: Different from SFM alone, p<0.001, unpaired t-test; double asterisk: p<0.0001). (D) LPA and serum drive comparably efficient chemotaxis. WM239A cells were examined in a chamber responding to 0%–10% FBS and 0–1 µM LPA. The spider plot shows similar cellular responses to the two gradients. (E) Quantitative analysis of chemotaxis towards LPA and serum. Chemotactic index was calculated from three experiments including that shown in (D). Cells respond comparably to both conditions. Bars show SEM.

