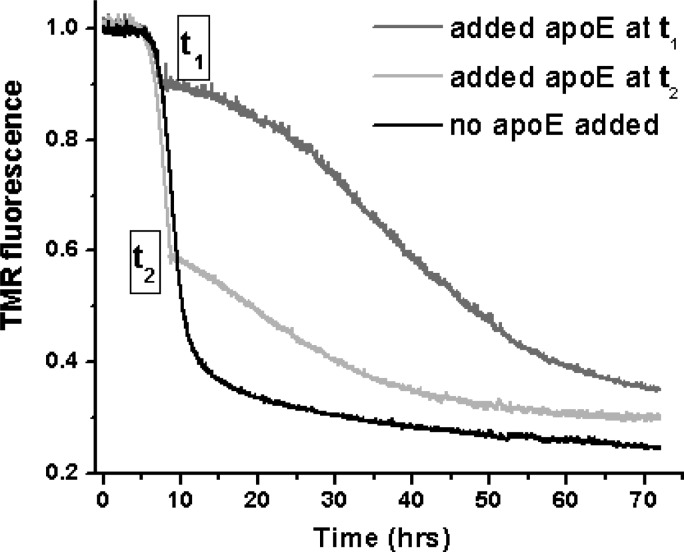
Figure 2.
Effect of apoE on the Aβ growth phase. The black line represents the time course of aggregation of TMR-Aβ1–40 (4 μM) in the absence of apoE. The dark gray and light gray lines represent the time courses when 200 nM recombinant lipid-free apoE4 is added during the growth phase at times t1 and t2, respectively.

