
Figure 5.
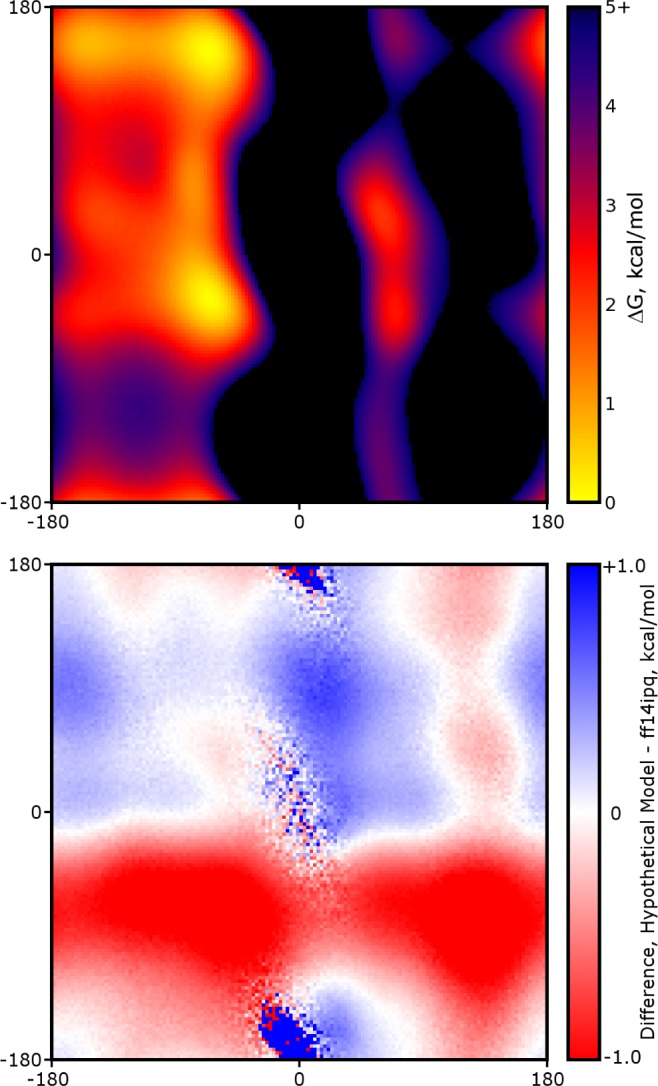
Difference plot of the alanine dipeptide PMF with torsion parameters derived for QIPol rather than Qvac. The color scheme is similar to difference plots in Figure 4: here, solid red implies that a hypothetical (and incorrect) model fitting gas-phase quantum data in the context of charges appropriate to the solution-phase estimates a point in ϕ/ψ space more than 1 kcal/mol more favorably than a properly tuned model; solid blue would imply that the incorrect model disfavors the conformation.