
Figure 9.
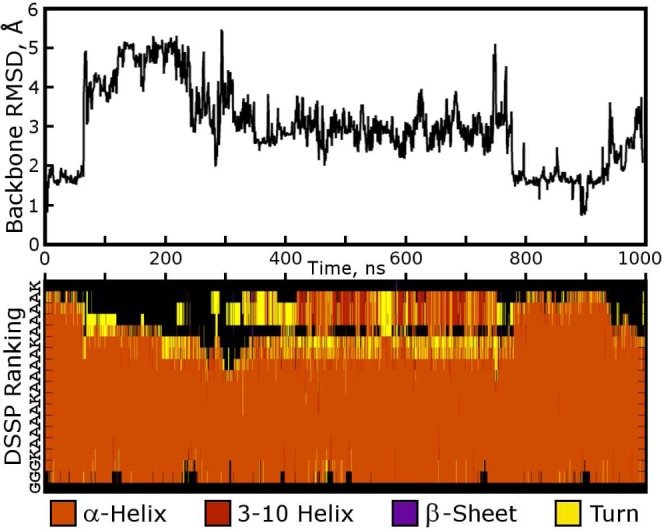
Backbone stability of K19 over a 500 ns simulation. The time axis applies to both the rmsd plot in the top panel and the DSSP plot in the lower panel. The K19 peptide is predominantly α-helical, with some instability at the C-terminus. Residues 16–19 begin to adopt a metastable 3–10 helical conformation near the middle of the simulation.