
Figure 3.
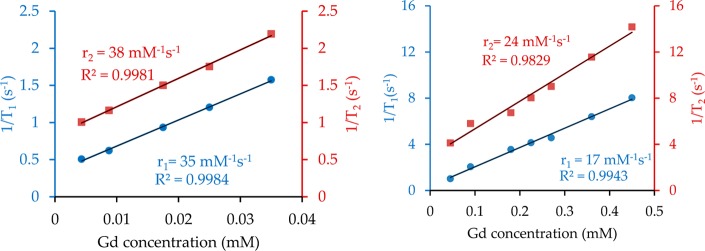
Plots of 1/Ti (i = 1, 2) vs the Gd3+ concentration at magnetic field strengths of 1.4 T (left) and 7.0 T (right) for PVP-C-KGdFeCN NPs.
Official websites use .gov
A
.gov website belongs to an official
government organization in the United States.
Secure .gov websites use HTTPS
A lock (
) or https:// means you've safely
connected to the .gov website. Share sensitive
information only on official, secure websites.
Plots of 1/Ti (i = 1, 2) vs the Gd3+ concentration at magnetic field strengths of 1.4 T (left) and 7.0 T (right) for PVP-C-KGdFeCN NPs.