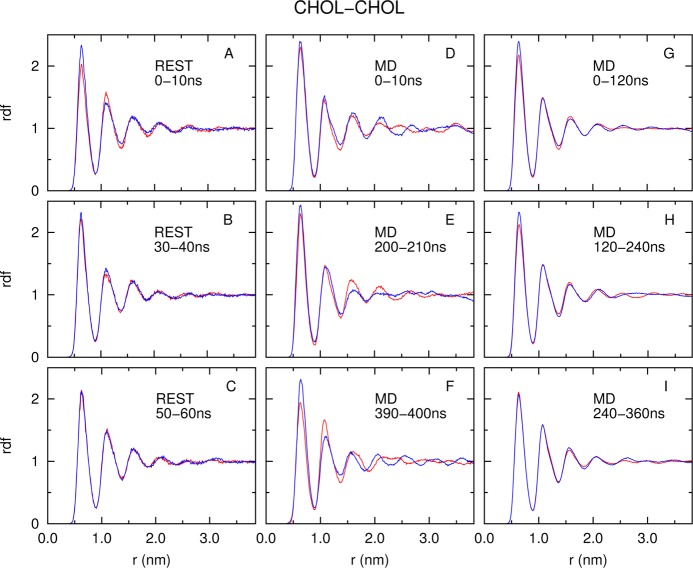
Figure 4.
Lateral radial distribution (rdf) function of CHOL–CHOL center of mass distances calculated from the REST and MD simulations. The time block used to calculate rdf is indicated in each subplot. The blue/red line in each subplot represents the rdf calculated from the upper/lower monolayer, respectively.

