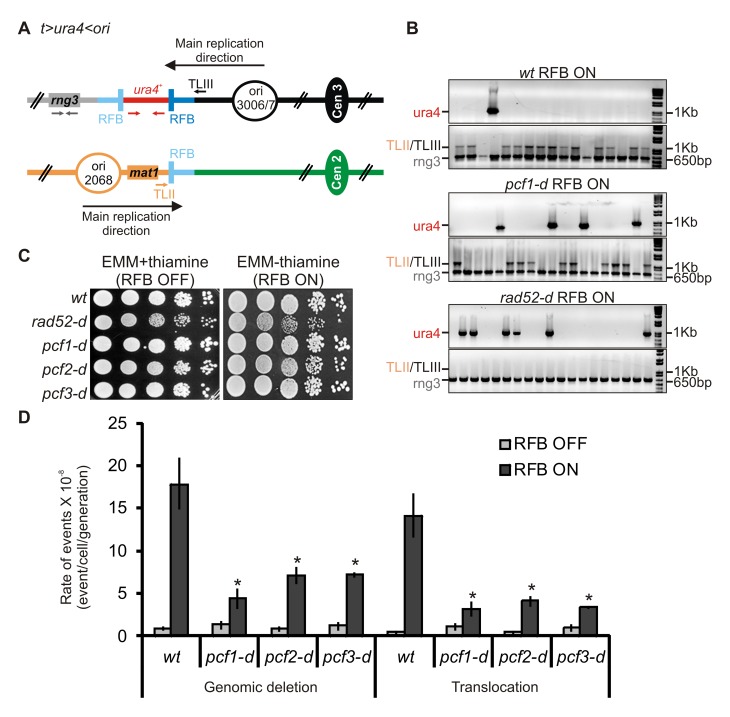
Figure 2. CAF-1 promotes faulty template switch at blocked replication forks.
(A) Diagram of the t> ura4 <ori locus, in which t refers to the telomere (gray lines), ura4 refers to the wt gene (red lines),> and <refers to the polarity of the two RTS1-RFB (blue bars, the darkest blue one corresponds to the most efficient RFB), and ori refers to the replication origin (opened black circle) on the centromere-proximal side. A RTS1-RFB is naturally located on chromosome II. The green and black circles indicate the centromere of chromosomes II and III, respectively. Fork arrest at the RTS1-RFB on chromosome III leads to ectopic recombination with the RTS1 sequence located on chromosome II, resulting in ura4 loss and genomic deletion associated or not with a translocation between chromosomes II and III. The loss of ura4 is genetically selected using the 5-FOA drug that allows the selection of cells exhibiting a loss of ura4+ function (deletion or mutation). Primers used for amplifying the 1 Kb ura4 fragment or the 650 bp rng3 fragment are depicted in red and grey, respectively. Primers used to amplify the translocation junction (1.2 kb) are represented in orange on chromosome II (TLII) and in black on chromosome III (TLIII). (B) Representative PCR-amplification from 5-FOA–resistant colonies from indicated strains and conditions. PCR products and their sizes are indicated on the figure. (C) Survival of indicated strains upon fork arrest at the t> ura4 <ori locus. Serial 10-fold dilution from indicated strains spotted onto media containing thiamine (RFB OFF) or not (RFB ON). (D) Rate of genomic deletion and translocation for the strains indicated; ON and OFF refers to the RTS1-RFB being active or not, respectively. The percentage of deletion and translocation events, as determined by the PCR assay, was used to balance the rate of ura4 loss. The values reported are means of at least three independent median rates ± standard deviation (SD). Statistically significant fold differences in the rates of deletion or translocation events from the wt strain are indicated with a asterisk (p<0.01). Statistical significance was calculated using the nonparametric Mann–Whitney U test. Refer to Data S1, sheet 1.

