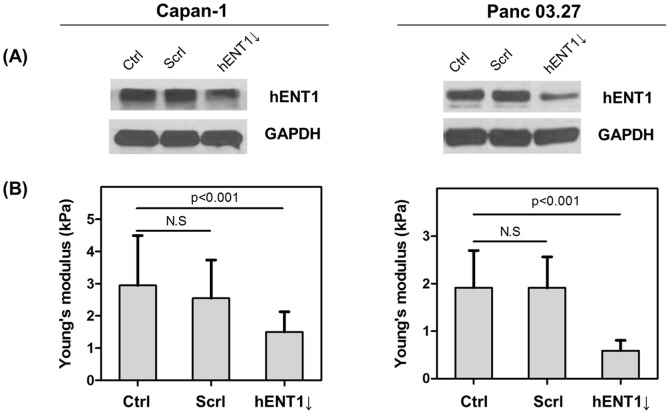
Figure 2. Establish hENT1 knockdown pancreatic cancer cell lines.
(A) Western blots of hENT1 (55 kDa) and GAPDH (37 kDa) in Capan-1 (left) and Panc 03.27 cells (right) without treatment (ctrl) or after treatment of negative siRNA (scrl) or hENT1 siRNA (hENT1↓), (B) Bar histograms show Young's modulus of control, negative siRNA transfected, and hENT1 knockdown cells. (N.S: statistically not significant).

