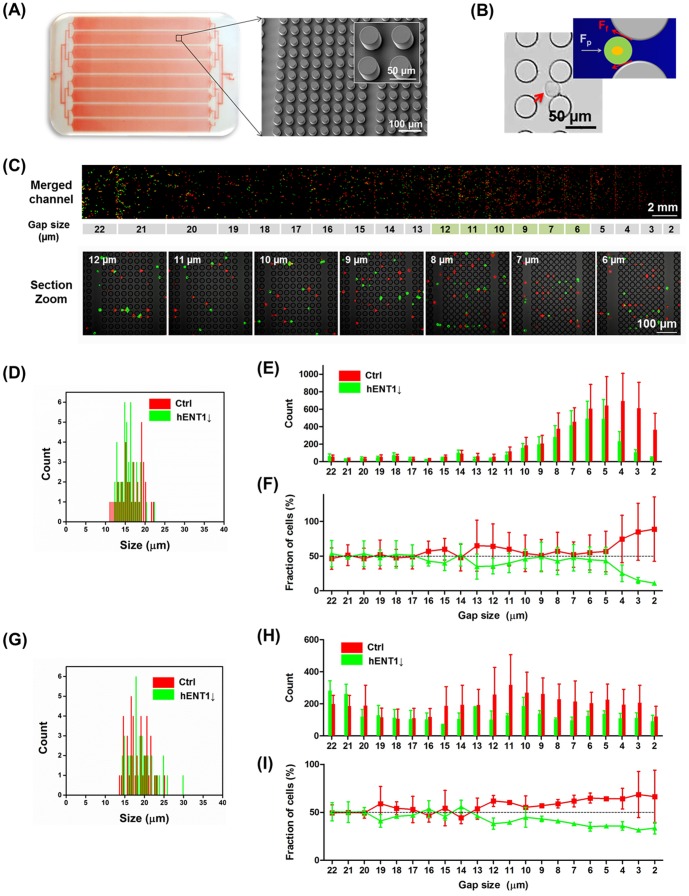
Figure 3. Compare deformability of control and hENT1 knockdown cells using a microfluidic separation chip.
(A) Photograph (left) of microfluidic separation chip (MS-chip) visualized by red dye inside and a representative scanning electron microscopic (right) image of the post array (diameter of pillar: 35 µm, height of pillar: 30 µm). (B) Bright field image and scheme of cells flowing in MS-chip when the cell diameter is smaller than pillar gap size (red arrow indicates cells). It is assumed here that friction is due only to shear stress (Fp: pressure force against the applied pressure (10 psi in this study), Ff: friction force). (C) The fluorescence image of one of channels among eight shows retained Panc 03.27 cells in the MS-chip after separation of Panc 03.27-ctrl (red fluorescence) and Panc 03.27-hENT1 knockdown (green fluorescence). Representative higher magnification confocal microscopic images of the MS chip (gap size from 12 µm to 6 µm) show the efficiency of separation through gaps. Size distribution of cells (D: Capan-1, G: Panc 03.27 cells). Statistical analysis of cells (E: Capan-1, H: Panc 03.27) and fraction ratio of cells (F: Capan-1, I: Panc 03.27) retained on chip. Values represent mean ± standard deviation.

