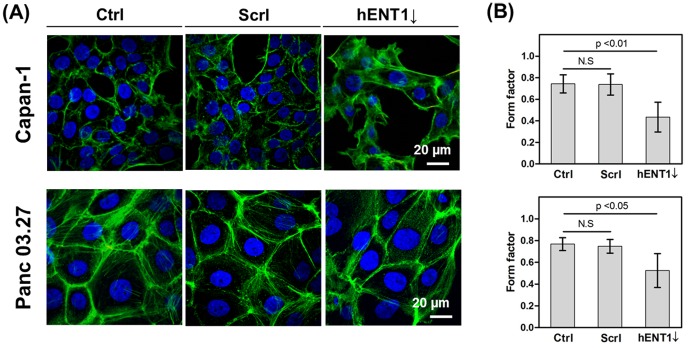
Figure 4. Quantify cell roundness.
(A) Representative confocal micrographs of pancreatic cells (Top panel: Capan-1, Bottom panel: Panc 03.27) showing F-actin distribution, (B) form factor (f = 4πa/p2; a: area; p: perimeter) analyzed by Image J (Capan-1 cells, ctrl: n = 37, scrl: n = 59, hENT1↓: n = 29; Panc 03.27, ctrl: n = 36, scrl: n = 28, hENT1↓:n = 28, N.S: statistically not significant).

