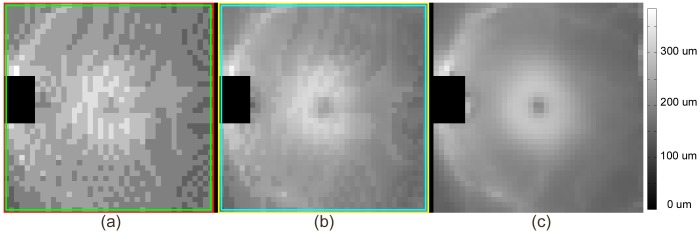
Figure 11. Example of tissue thickness map of the region bounded by two coupled terrain-like surfaces (the layer containing the outer segments of the retinal photoreceptors) segmented by (a) Conventional graph search of “input volume data” delineated by the red and green surfaces in Fig. 10 (b); (b) Non-Euclidean graph search of “input volume data” delineated by the yellow and cyan surfaces in Fig. 10 (b); (c) Mapping from segmentation results of the reference standard volume.

