Abstract
Objectives
The aim of this study was to compare the contrast-to-noise ratio (CNR) values of infarct and remote myocardium as well as infarct and blood after application of 0.1 mmol/kg gadobutrol and 0.1 mmol/kg gadobenate dimeglumine on late gadolinium enhancement magnetic resonance (MR) images.
Material and Methods
The study was a prospective randomized controlled clinical study. After informed consent was obtained, 20 patients (12 men, 8 women; mean age, 67 ± 11 years) with known chronic myocardial infarction were included for an intraindividual comparison of a single-dose gadobutrol and a single-dose gadobenate dimeglumine. Two MR imaging examinations were performed within a period of 28 days in a crossover design. Late gadolinium enhancement imaging was performed 10 minutes after gadolinium administration using a 2-dimensional phase-sensitive inversion recovery gradient echo sequence at 3 T. Infarct size, signal intensities (SIs), signal-to-noise ratio, and CNR were determined on phase-sensitive MR images. Values for CNR were calculated as CNRinfarct/myocardium = (SIinfarct − SImyocardium)/SDnoise and CNRinfarct/blood = (SIinfarct − SIblood)/SDnoise. In addition, the areas of myocardial infarction were determined on single slices. The entire infarct volumes were calculated by adding the areas with hyperenhancement multiplied by the slice thickness.
Results
Late gadolinium enhancement was present in all patients. Median values of the infarct area, infarct volume, and transmurality for gadobutrol and gadobenate dimeglumine showed good to excellent concordance (rc = 0.85, rc = 0.95, and rc = 0.71, respectively). The mean signal-to-noise ratio values for infarct, remote myocardium, and ventricular blood were 18.6 ± 6.5, 4.1 ± 3.7, and 14.6 ± 7.5, respectively, for gadobutrol and 18.8 ± 8.9, 4.9 ± 4.5, and 17.8 ± 10.1, respectively, for gadobenate dimeglumine (P = 0.93, P = 0.48, and P = 0.149, respectively). The mean values of CNRinfarct/myocardium and CNRinfarct/blood were 14.5 ± 5.9 and 4.0 ± 4.6, respectively, for gadobutrol and 13.9 ± 6.1 and 0.9 ± 4.5, respectively, for gadobenate dimeglumine (P = 0.69 and P = 0.02, respectively).
Conclusion
Both gadobutrol and gadobenate dimeglumine allow for successful late gadolinium enhancement imaging of chronic myocardial infarction after a single-dose application (0.1 mmol/kg) at 3 T. Gadobutrol provides a higher CNR between infarct and blood. The CNRs between infarct and normal myocardium, infarct size, and transmural extent were similar for both contrast agents.
Key Words: myocardial infarction, magnetic resonance imaging, late gadolinium enhancement, contrast agent
Precise assessment of the presence and extent of ischemic injury is of clinical importance in the treatment of patients with acute and chronic myocardial infarction for risk stratification and therapy.1 The transmural extent of myocardial infarction predicts regional functional recovery after revascularization.2 The extent of the ischemic scar is directly correlated with the outcome after myocardial infarction.3
Magnetic resonance imaging (MRI) with the use of gadolinium-containing contrast agents has been proven as the most accurate method for the assessment of myocardial infarction size owing to its high spatial resolution. Myocardial infarction reveals late gadolinium enhancement (LGE) due to local extravasation in the myocardial scar and delayed washout.2 In contrast to myocardial infarction, normal myocardium appears dark after individual adaptation of the inversion time (TI), when inversion recovery gradient echo techniques are used.4 Gadopentetate dimeglumine applied at a “double dose” (0.2 mmol/kg) is the most widely used contrast agent for LGE imaging with MRI.2,3 Gadobutrol is a macrocylic nonionic gadolinium-based contrast agent, provided at a 1.0 molar concentration, which has no relevant protein-binding properties. It has a higher relaxivity (r1 = 5.0 mmol−1 s−1 and r2 = 7.1 mmol−1 s−1 at 3 T) compared with gadopentetate dimeglumine (r1 = 3.7 mmol−1 s−1 and r2 = 5.2 mmol−1 s−1 at 3 T).5 Gadobutrol has been proven to allow for successful LGE imaging at the standard double dose,6–8 at 0.15 mmol/kg,9,10 and at 0.1 mmol/kg.11,12 Gadobenate dimeglumine, provided at a 0.5 molar concentration, is a linear contrast agent that exhibits a weak, transient interaction with serum albumin and is therefore considered to be temporarily protein binding. Its relaxivity (r1 = 5.5 mmol−1 s−1 and r2 = 11.0 mmol−1 s−1 at 3 T) is about 2-fold higher compared with gadopentetate dimeglumine.5,13 Previous studies suggest that because of the binding of gadobenate dimeglumine to serum albumin, the contrast of the infarct and left ventricular blood may be reduced.14 Up to now, a direct comparison of gadobutrol and gadobenate dimeglumine at a single dose of 0.1 mmol/kg has not been published yet.
The aim of the study was to perform an intraindividual comparison of the contrast-to-noise ratio (CNR) values of infarct and remote myocardium as well as infarct and blood after 0.1 mmol/kg gadobutrol versus 0.1 mmol/kg gadobenate dimeglumine on LGE magnetic resonance (MR) acquired at 3 T in a randomized crossover design. We hypothesized that gadobutrol may provide a superior contrast between the infarcted myocardium and the left ventricular blood after a single-dose application, whereas the extent of myocardial infarction may be assessed accurately and similarly with both contrast agents.
MATERIAL AND METHODS
Study Design
The study was designed as a clinical prospective, randomized, and controlled study. The study was approved by the local institutional review board and by the BfArM (Bundesinstitut für Arzneimittel und Medizinprodukte). The study is registered by the European Community Clinical Trial System (EudraCT no. 2010-022570-13) and under ClinicalTrials.gov (NCT01655290). For intraindividual comparison of gadobutrol versus gadobenate dimeglumine, patients were recruited for 2 consecutive MRI examinations within 2 to 28 days. At each visit, 1 of the 2 contrast agents was applied (crossover design). The permutation randomization of the order of contrast agent application was performed using closed envelopes. The order of contrast agent administration was blinded to the patients.
Patients
A total of 20 patients (12 men, 8 women) with chronic Q-wave myocardial infarction (positive electrocardiographic results and evidence of typical biochemical markers in patient history) were included. The mean age of infarction was 3.7 ± 1.1 years. Written informed consent was obtained from all patients. The mean age of the patients was 67 ± 11 years. The mean weight was 77 ± 13 kg. CINE MRI revealed a mean stroke volume of 62 ± 20 mL and a mean ejection fraction of 59% ± 10%. Exclusion criteria were an impaired renal function with a glomerular filtration rate lower than 30 mL/min, allergies against gadolinium-containing contrast agents, cardiac pacemaker, as well as refused consent or disability to give appropriate informed consent.
MR Imaging
Magnetic resonance imaging was performed on a 3-T MR system (Ingenia, Philips Healthcare, Best, the Netherlands) with novel dual-transmit technology (maximum gradient amplitude, 45 mT/m; slew rate, 200 T/m/s; rise time, 0.2 milliseconds) and a standard 12-element posterior and 12-element anterior coil. Before contrast agent administration, CINE images were acquired in standard orientations (2-, 3-, and 4-chamber views and a stack of short-axis images) for the assessment of cardiac function using a standard 2-dimensional (2D) steady-state free precession pulse sequence with the following parameters: typical field of view, 413 × 413 mm; acquisition matrix, 216 × 214; reconstruction matrix, 336 × 336; slice thickness, 8 mm; reconstructed in-plane resolution, 1.2/1.2 mm; repetition time/echo time, 2.9/1.4 milliseconds; flip angle, 45°; temporal resolution, 42 milliseconds.
For LGE imaging, a 2D phase-sensitive inversion recovery (PSIR) gradient echo sequence was used including the following typical parameters: field of view, 350 × 350 mm; acquisition matrix, 220 × 178; reconstruction matrix, 384 × 384; bandwidth, 229 Hz/Px; slice thickness, 8 mm; no gap; flip angle, 25° (flip angle for the reference segment, 5°); repetition time/echo time, 6.1/3.0 milliseconds; reconstructed in-plane resolution, 0.9 mm × 0.9 mm. The optimal TI was determined using a standard Look-Locker sequence. Late gadolinium enhancement images were acquired 10 minutes after contrast agent injection. According to the randomization, either 0.1 mmol/kg gadobutrol (Bayer Healthcare, Berlin, Germany) or 0.1 mmol/kg gadobenate dimeglumine (Bracco Imaging, Konstanz, Germany) was applied. Contrast agents were injected at a rate of 1 mL/s followed by a bolus injection of 30 mL saline at an identical flow rate.
Image Analysis
Analysis of LGE images was performed in a blinded manner. Images were analyzed on the day of acquisition. Thus, the results between the 2 contrast agents could not be directly compared during the analysis. Image analysis was performed using the Osirix software (Osirix Foundation, Geneva, Switzerland) by 2 independent radiologists with 7 and 15 years of experience with cardiac MRI. Short-axis CINE stacks were used for determination of the global left ventricular functional parameters ejection fraction, end-diastolic volume, end-systolic volume, and left ventricular myocardial mass. Endocardial and epicardial contours and the end of the diastole and the end of systole were traced semiautomatically and manually corrected where necessary.
Phase-sensitive reconstructed images in short-axis orientation were used for LGE analysis. Areas of LGE were traced semiautomatically using the Osirix plugin. The contours were manually adjusted where necessary. Infarct areas were defined as regions with signal intensities higher than 2 standard deviations (SDs) compared with the signal intensities of remote myocardium. Infarct delineation from the remote myocardium was precise in all cases. The differentiation of infarct from a bright blood pool required manual corrections in 4 cases. For determination of infarct area on a single slice, the image with the highest transmural extent was selected. Entire infarct volumes were determined by adding the LGE-positive infarct areas of each short axis image multiplied by the slice thickness. Transmurality of infarct extension was measured as maximum infarct thickness divided by the thickness of the entire myocardium and presented as a percentage value.
The infarct area determined on a selected short axis image, the entire infarct volume, and the maximum of the transmural extent were determined. Values of both contrast agents were compared. In addition, the number of affected myocardial segments with LGE was determined for each examination. The bulls-eye plots reveal the results according to the 17-segment model of the American Heart Association.
Mean ± SD values of signal intensity (SI) were measured in infarcted myocardium, in remote left ventricular myocardium, and in the left ventricular cavity (blood pool). Noise determination on PSIR imaging is considered to be critical. Usually, image noise is determined as the SD in a region of interest (ROI) outside the patient. However, for phase-sensitive images, it has been suggested that noise determination is performed in a region close to the ROI of the target lesion.15 Thus, we estimated noise by the SD of SI in the remote myocardium. The signal-to-noise ratio (SNR) was defined as mean SI in the ROI divided by the SD of SI in the remote myocardium. The CNR was defined as the difference of mean SI of 2 ROIs divided by the SD of SI in the remote myocardium.
Statistics
Statistical analysis was performed using Prism 5.0 a (Graph Pad Software Inc, San Diego, CA) and R 3.0.1 (R Foundation for Statistical Computing, Vienna, Austria). Demographic patient data, stroke volume, and ejection fraction are presented as mean ± SD. The distribution of infarct area on a selected short-axis slice, the entire infarct volume, and the transmural extent are presented as median and range because of deviations from the normal distribution. Agreement of measurements resulting from the application of the 2 contrast agents was assessed by Lin concordance correlation coefficient and Bland-Altman plots. The former was computed on ranked data to avoid bias induced by extreme values. The distribution of SNR and CNR values is given by mean ± SD. Differences between the 2 contrast agents were investigated by a 2-sided t test for paired samples. Owing to the crossover design of the study, it was also checked for possible interaction effects of contrast agent and study period, using a 2-sided t test. No evidence fur such interaction effect was found (P > 0.05). All statistical tests were performed in an explorative manner on a 5% significance level.
RESULTS
All 20 patients completed the 2 MRI examinations. Positive LGE, typical for myocardial infarction, was found in all patients. In 4 patients, transmural infarctions were found, and in 16 patients, nontransmural infarctions were found. The median values for the infarct area on a selected slice were 2.0 cm2 (0.1–5.3 cm2) for gadobutrol and 1.9 cm2 (0.2–4.9 cm2) for gadobenate dimeglumine. The infarct areas determined on LGE images on a selected slice showed high concordance between gadobutrol and gadobenate dimeglumine (rc = 0.85; 95% confidence interval [CI], 0.67–0.93; Fig. 1A). The Bland-Altman analysis revealed a mean difference of only 0.1% between the 2 methods, with upper and lower 95% limits of agreement at 0.9% and −0.7% (Fig. 1B). The median values of the infarct volume were 7.7 cm3 (0.1–17.8 cm3) and 6.8 cm3 (0.3–16.3 cm3). The entire infarct volume determined with both contrast agents on LGE images showed excellent concordance (rc = 0.95; 95% CI, 0.89–0.98) and minor difference of 0.6% using the Bland-Altman analysis, with upper and lower 95% limits of agreement at 2.7% and −1.4% (Fig. 1, C and D). The median values for transmural extent of myocardial infarction were 52% (31%–100%) for gadobutrol and 50% (30%–100%) for gadobenate dimeglumine. When comparing the transmural extent of the infarct scar on LGE images, gadobutrol and gadobenate dimeglumine showed comparable extent with good concordance (rc = 0.71; 95% CI, 0.40–0.87) and almost no difference between the methods in the Bland-Altman analysis (mean difference = 0.1 with upper and lower 95% limit of agreement at 0.2% and −0.1%; Fig. 1, E and F).
FIGURE 1.
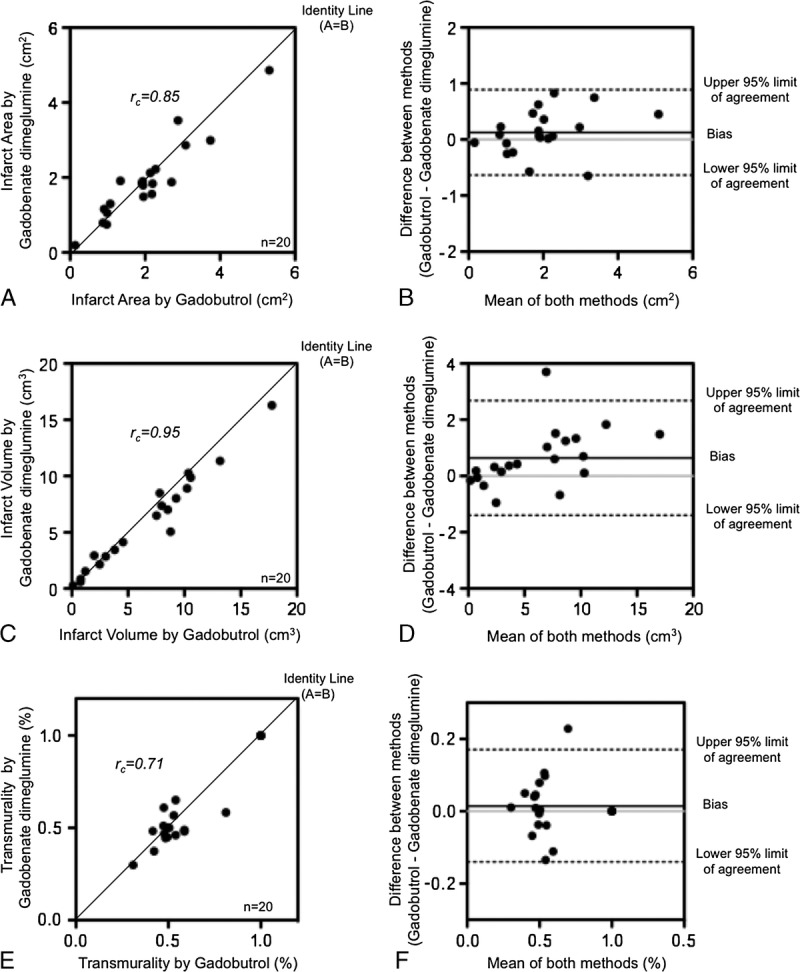
Comparison of the infarct size on MR images, acquired after application gadobutrol and after application of gadobenate dimeglumine. A, The scatter diagram reveals the concordance of the infarct area determined on a selected plane. B, The Bland-Altman plot reveals the limits of agreement and percentage of the mean differences of the infarct areas determined on selected slices. C, The scatter diagram reveals the concordance of the entire infarct volume. D, The Bland-Altman plot reveals the limits of agreement and percentage of the mean differences of the infarct volumes. E, The scatter diagram reveals the concordance of the transmurality of the myocardial infarction. F, The Bland-Altman plot reveals the limits of agreement and the percentage of the mean differences of the transmural extent of the myocardial infarctions.
The analysis of the left ventricular myocardial segments affected by infarction according to the 17-segment model of the American Heart Association in all patients revealed 86 segments with LGE on gadobenate dimeglumine–enhanced images and 88 positive segments on gadobutrol-enhanced images. Discrepancies were found in 12 segments between the 2 contrast agents (Fig. 2).
FIGURE 2.
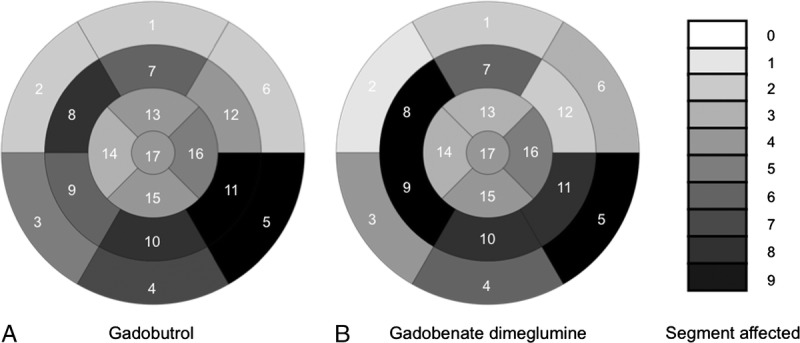
Overall evaluation of 20 patients. Bulls-eye plots show the number of segments affected by LGE according to the 17-segment American Heart Association model. The number, how often a certain segment is affected in the 20 patients, is encoded in gray colors indicated on the right. A, Bulls-eye plot of MR images acquired after application of gadobutrol. B, Bulls-eye plot of MR images acquired after application of gadobenate dimeglumine.
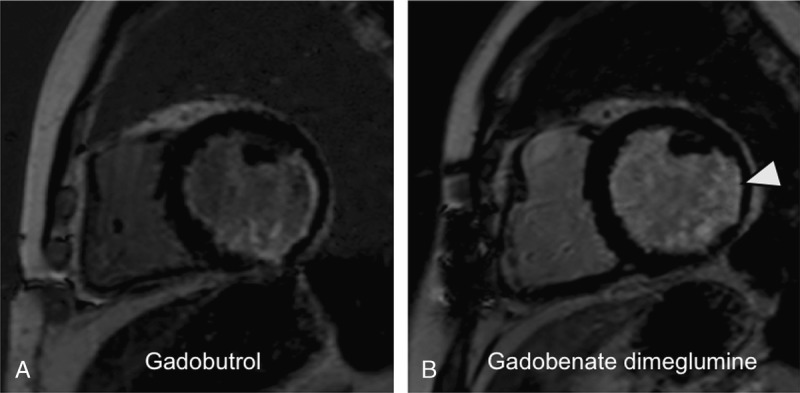
The mean SNR and CNR values are given in Table 1. The distribution of values is shown by box plots in Figure 3. Mean SNR values of infarct, remote myocardium, and blood showed only minimal differences between gadobutrol and gadobenate dimeglumine (Fig. 3C). The comparison of the mean CNRinfarct/myocardium values between the 2 contrast agents (Fig. 3D) showed similar high contrast between the infarct and the remote myocardium (P = 0.69). The mean CNRinfarct/blood of infarct and left ventricular blood, however, was significantly higher on gadobutrol-enhanced images compared with gadobenate dimeglumine (P = 0.02, Fig. 3E). The mean TI did not differ significantly on gadobutrol (273 ± 26 milliseconds) compared with gadobenate dimeglumine–enhanced images (286 ± 31 milliseconds; P = 0.81). Examples of 3 patients demonstrate comparably high CNRinfarct/myocardium for both gadobutrol and gadobenate dimeglumine but higher CNRinfarct/blood for gadobutrol (Figs. 4–6).
TABLE 1.
SNR and CNR Values

FIGURE 3.
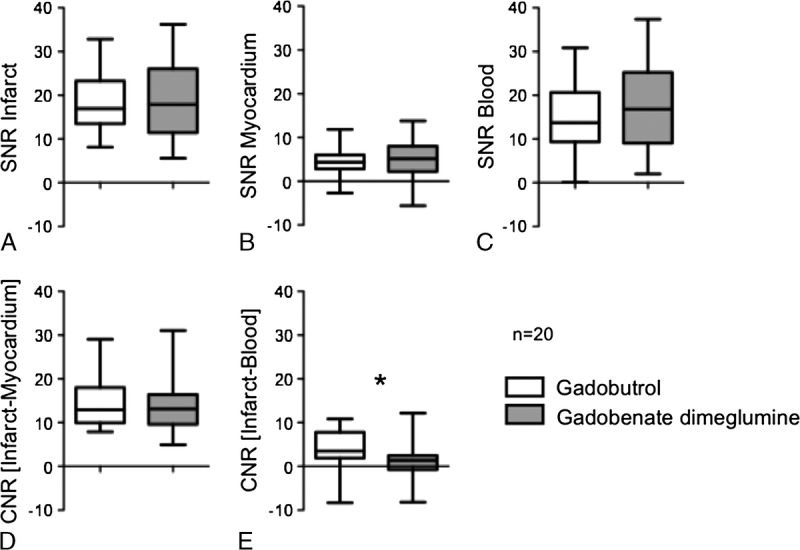
The box plots (horizontal lines by increasing order: minimum, 25%, 50% (median), 75% percentile, maximum) show the distribution of SNR and CNR values for gadobutrol and gadobenate dimeglumine. A, Median values of SNR for myocardial infarction (P = 0.93). B, Median values of SNR of normal myocardium (P = 0.48). C, Median values of SNR for left ventricular blood (P = 0.15). D, Median values of CNRinfarct/myocardium for myocardial infarction and normal myocardium (P = 0.67). E, Median values of CNRinfarct/blood for myocardial infarction and left ventricular blood (P = 0.02). *Statistically significant difference.
FIGURE 4.
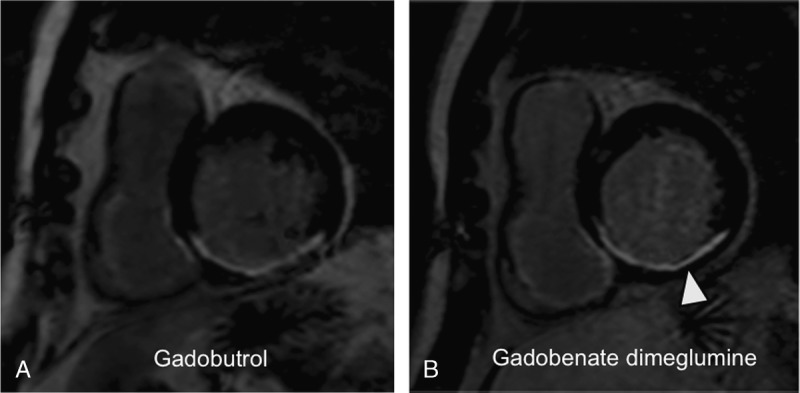
A 65-year-old male patient with myocardial infarction after occlusion of the right coronary artery and successful percutaneous coronary intervention 2 years ago: LGE MR images in short-axis orientation reveal a myocardial infarction in the inferior, inferoseptal, and inferolateral segments. The myocardial infarction reveals a nontransmural extent (arrowhead). A, MR image acquired after administration of 0.1 mmol/kg gadobutrol. B, MR image acquired after administration of 0.1 mmol/kg gadobenate dimeglumine. The nontransmural infarct scar shows a similar infarct area and transmural extent as well as affection of myocardial segments compared with panel A. The contrast between infarct and normal myocardium appears similar on both images; the contrast of infarct and left ventricular blood appears lower after application of gadobenate dimeglumine.
FIGURE 6.
A 69-year-old female patient with myocardial infarction after occlusion of the left circumflex coronary artery and a high-grade stenosis in the right coronary artery: LGE MR images in short-axis orientation reveal a myocardial infarction in the lateral, inferoseptal, and inferior segments. The myocardial infarction reveals a nontransmural extent (arrowhead). A, MR image acquired after administration of 0.1 mmol/kg gadobutrol. B, MR image acquired after administration of 0.1 mmol/kg gadobenate dimeglumine. The nontransmural infarct scar shows a similar infarct area and transmural extent as well as affection of myocardial segments compared with panel A. The contrast between infarct and normal myocardium appears better after gadobutrol. The contrast of infarct and left ventricular blood appears weak after application of gadobenate dimeglumine.
FIGURE 5.
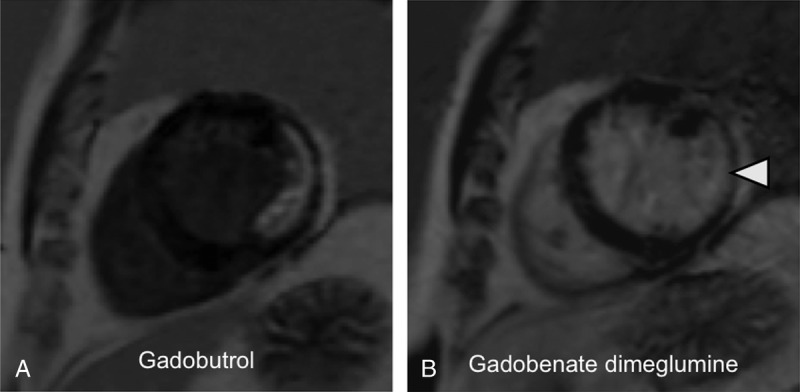
A 54-year-old male patient with myocardial infarction after occlusion of the left circumflex artery and successful bypass surgery 3 years ago: LGE MR images in short-axis orientation reveal a myocardial infarction in the lateral and inferolateral segments. The myocardial infarction reveals a nontransmural extent (arrowhead). A, MR image acquired after administration of 0.1 mmol/kg gadobutrol. B, MR image acquired after administration of 0.1 mmol/kg gadobenate dimeglumine. The nontransmural infarct scar shows a similar infarct area and transmural extent as well as affection of myocardial segments compared with panel A. The contrast between infarct and normal myocardium appears similar on both images; however, the contrast of infarct and left ventricular blood appears weak after application of gadobenate dimeglumine.
DISCUSSION
Currently, LGE imaging by MRI is the most accurate method to determine the extent of ischemic injury to the myocardium with high spatial resolution.2 It provides a high contrast between infarct and normal myocardium and a high contrast between infarct and the left ventricular blood. To our knowledge, there is not much experience in the current literature concerning a comparison of a single-dose gadobutrol and gadobenate at 3.0 T for LGE imaging of myocardial infarction. There are differences in contrast agent behavior beyond known relaxivities between 1.5 and 3.0 T, which are currently not well investigated. A short delay time after contrast material application of 10 minutes is advantageous compared with a longer delay time of 30 minutes, both for improvement of contrast between infarction and viable myocardium as well as for reducing the entire room time. The use of a single-dose contrast agent instead of a double dose is cost effective and may reduce the risk of nephrogenic systemic fibrosis (NSF).
In the current study, we compared 2 high-relaxivity contrast agents, gadobutrol and gadobenate dimeglumine, for late-gadolinium enhancement of chronic myocardial infarction at 3 T. A field strength of 3 T is becoming more commonly used for clinical MRI examinations, as the SNR increases proportionally to B0 in theory with subsequent higher SNR and CNR values. The determination of the correct TI is important to obtain a high contrast between the bright infarcted and the remote myocardium on magnitude images. Failure in choosing the correct TI can lead to a severe loss of contrast and image artifacts. Therefore, Kellman et al15 implemented a PSIR technique for LGE imaging. It has been shown that PSIR imaging provides a high and stable CNR between infarct and normal myocardium, even when short default TIs are used. Thus, the need to determine the correct TI can be avoided and a more consistent image quality can be achieved.16,17 We chose a segmented 2D PSIR gradient echo sequence for LGE imaging in our study protocol. However, we used an individual adaptation of the TI to make images, acquired after the application of the 2 different contrast agents, as comparable as possible. Our results demonstrate that gadobutrol and gadobenate dimeglumine administered at a dose of 0.1 mmol/kg are similarly effective in determining the size of the infarcted myocardium. With the infarct area determined on a selected slice, the entire infarct volume and the transmural extent showed high concordance for LGE imaging with gadobutrol and gadobenate dimeglumine. Gadobutrol provided a higher contrast between infarcted myocardium and the left ventricular blood compared with gadobenate dimeglumine. According to previous observations,14 the SI in the left ventricular cavity is still high when images are acquired 10 minutes after the application of gadobenate dimeglumine. The protein binding properties of gadobenate dimeglumine are considered to be responsible for this observation. In a previous study, Secchi et al14 detected only a minor contrast between left ventricular cavity and adjacent infarcted myocardium at 1.5 T. A delay of at least 10 minutes seems to be necessary to allow for a certain clearing of gadobenate dimeglumine from the blood with subsequently improved contrast between infarct and blood. When using gadobutrol at a dose of 0.1 mmol/kg, LGE imaging seems to be possible already at 10 minutes after contrast injection, with high CNR between infarcted and remote myocardium as well as between infarcted myocardium and blood. The blood half-life of gadobenate dimeglumine and gadobutrol in healthy subjects is reported in a similar range of 1.5 hours, which, however, increases dramatically in case of decreased renal function.18 As all patients included in our study had similarly normal renal function, a significant impact of renal clearance on the blood pool contrast is considered as unlikely.
Although rare, NSF is the most feared complication in patients with impaired renal function. Patients with coronary artery disease are more frequently affected by renal impairment than the normal population.19 Therefore, using a lower dose of gadolinium-based contrast agents and switching to safer contrast agents are important goals in patients with coronary artery disease. Macrocyclic contrast agents such as gadobutrol are considered to be safer than linear gadolinium compounds with regard to the risk for NSF owing to their higher thermodynamic stability.20,21 Currently, it is recommended to avoid linear gadolinium chelates in patients with impaired renal function.22 Gadobenate dimeglumine has a linear structure; however, it is considered only as an “intermediate-risk” contrast agent that is recommended to be used instead of gadopentetate dimeglumine in patients with impaired renal function.23 When evaluating the risk of gadolinium-based MR contrast agents, the complex stability and the associated Gd3+ dissociation rate are decisive. When compared with gadopentetate dimeglumine, gadobenate dimeglumine exhibits a similar rate of Gd3+ release, indicating that these complexes are equally stable.20 Instead of linear gadolinium agents, macrocyclic gadolinium chelates such as gadobutrol are recommended.22 Gadobutrol has been successfully evaluated for imaging viability at the standard double dose of 0.2 mmol/kg,6–8 at a dose of 0.15 mmol/kg,9,10 and at a dose of 0.1 mmol/kg,11,12 both at 1.5 and 3.0 T. Durmus et al9,10 have shown that gadobutrol at a dose of 0.15 mmol/kg provides excellent contrast between infarcted and remote myocardium and achieves a higher contrast between infarct and left ventricular cavity when compared with 0.2 mmol gadopentetate dimeglumine and 0.2 mmol/kg gadoteric acid at 1.5 T. Only 1 study investigated the performance of a single-dose gadobutrol application at 3 T in imaging myocardial infarction.8
Gadobenate dimeglumine has a 2-fold higher r1 relaxivity compared with gadopentetate dimeglumine. Previous cardiac MRI studies have used gadobenate dimeglumine at concentrations of 0.05 mmol/kg,24 0.1 mmol/kg,25–27 and 0.2 mmol/kg.28,29 These studies report results derived from MR images acquired all at 1.5 T. A comparison between gadobenate dimeglumine and gadopentetate dimeglumine, when applied a dose of 0.2 mmol/kg, revealed higher CNRinfarct/myocardium values for infarcted and remote myocardium for gadobenate dimeglumine but superior CNRinfarct/blood values for the infarcted myocardium and left ventricular blood for gadopentetate dimeglumine.29 A single dose of 0.1 mmol/kg gadobenate dimeglumine provided higher CNRinfarct/myocardium when compared with 0.2 mmol/kg gadopentetate dimeglumine. However, no disadvantage concerning the CNRinfarct/blood was observed.26 T1 mapping at 3.0 T revealed similar extracellular volume fractions after 0.1 mmol/kg gadobenate dimeglumine compared with 0.15 mmol/kg gadopentetate dimeglumine.30 A direct comparison of 0.1 versus 0.2 mmol/kg gadobenate dimeglumine, despite a fractionated application, showed that 0.1 mmol/kg provides a high contrast between infarcted and remote myocardium already at 10 minutes after injection, with significantly increased CNRinfarct/myocardium values at 20 minutes after contrast agent application, performed at a field strength of 1.5 T.14 Ten minutes after injection of 0.1 mmol/kg gadobenate dimgelumine, Secchi et al14 observed no differences in CNRinfarct/blood values between infarcted myocardium and left ventricular blood. Only at 20 minutes was a statistically significant increase in CNRinfarct/blood observed at 1.5 T. This suggests that the prolonged clearance of gadobenate dimeglumine from the blood enables detection of smaller subendocardial myocardial infarctions only at late time points after gadolinium injection.14 The SI in the blood is almost similar compared with the infarcted myocardium, with poor contrast between both compartments at a dose of 0.2 mmol/kg gadobenate dimeglumine,14 which is in accordance with our results obtained with 0.1 mmol/kg at 3.0 T.
The following limitations apply to this study: The patient cohort of 20 individuals is rather small; however, results concerning SNR and CNR values seem to be clear. Studies including larger patient series may be performed to confirm these results. As discussed above, the extent and intensity of LGE were assessed only at 10 minutes after injection. Data acquisitions at a later time point after contrast material application can be expected to provide different CNR values, which may have especially an influence on CNR of infarct and left ventricular blood, when gadobenate dimeglumine is used. The LGE assessment was performed using a PSIR technique. Especially novel 3D acquisition techniques, various readout and reconstruction techniques may provide different CNR values, which have to be investigated.
In conclusion, both gadobutrol and gadobenate dimeglumine allow for successful LGE imaging at a reduced dose of 0.1 mmol/kg at 3 T. Ten minutes after injection, gadobutrol is superior compared with gadobenate dimeglumine concerning the contrast between infarct and the left ventricular cavity, which may be advantageous for the detection of small subendocardial infarctions. Contrast between infarct and myocardium, infarct areas, volumes, and transmurality are similar for both contrast agents.
Footnotes
Conflicts of interest and sources of funding: The study was supported by a research grant by Bayer Healthcare.
The authors report no conflicts of interest.
REFERENCES
- 1. Gersh BJ, Anderson JL. Thrombolysis and myocardial salvage. Results of clinical trials and the animal paradigm—paradoxic or predictable? Circulation. 1993; 88: 296– 306 [DOI] [PubMed] [Google Scholar]
- 2. Kim RJ, Wu E, Rafael A, et al. The use of contrast-enhanced magnetic resonance imaging to identify reversible myocardial dysfunction. N Engl J Med. 2000; 343: 1445– 1453 [DOI] [PubMed] [Google Scholar]
- 3. Kwong RY, Chan AK, Brown KA, et al. Impact of unrecognized myocardial scar detected by cardiac magnetic resonance imaging on event-free survival in patients presenting with signs or symptoms of coronary artery disease. Circulation. 2006; 113: 2733– 2743 [DOI] [PubMed] [Google Scholar]
- 4. Simonetti OP, Kim RJ, Fieno DS, et al. An improved MR imaging technique for the visualization of myocardial infarction. Radiology. 2001; 218: 215– 223 [DOI] [PubMed] [Google Scholar]
- 5. Rohrer M, Bauer H, Mintorovitch J, et al. Comparison of magnetic properties of MRI contrast media solutions at different magnetic field strengths. Invest Radiol. 2005; 40: 715– 724 [DOI] [PubMed] [Google Scholar]
- 6. Goetti R, Feuchtner G, Stolzmann P, et al. Delayed enhancement imaging of myocardial viability: low-dose high-pitch CT versus MRI. Eur Radiol. 2011; 21: 2091– 2099 [DOI] [PubMed] [Google Scholar]
- 7. Meyer C, Strach K, Thomas D, et al. High-resolution myocardial stress perfusion at 3 T in patients with suspected coronary artery disease. Eur Radiol. 2008; 18: 226– 233 [DOI] [PubMed] [Google Scholar]
- 8. Peel SA, Morton G, Chiribiri A, et al. Dual inversion-recovery MR imaging sequence for reduced blood signal on late gadolinium-enhanced images of myocardial scar. Radiology. 2012; 264: 242– 249 [DOI] [PubMed] [Google Scholar]
- 9. Durmus T, Schilling R, Doeblin P, et al. Gadobutrol for magnetic resonance imaging of chronic myocardial infarction: intraindividual comparison with gadopentetate dimeglumine. Invest Radiol. 2012; 47: 183– 188 [DOI] [PubMed] [Google Scholar]
- 10. Wagner M, Schilling R, Doeblin P, et al. Macrocyclic contrast agents for magnetic resonance imaging of chronic myocardial infarction: intraindividual comparison of gadobutrol and gadoterate meglumine. Eur Radiol. 2013; 23: 108– 114 [DOI] [PubMed] [Google Scholar]
- 11. Lonborg J, Vejlstrup N, Mathiasen AB, et al. Myocardial area at risk and salvage measured by T2-weighted cardiovascular magnetic resonance: reproducibility and comparison of two T2-weighted protocols. J Cardiovasc Magn Reson. 2011; 13: 50. [DOI] [PMC free article] [PubMed] [Google Scholar]
- 12. Pujadas S, Vidal-Perez R, Hidalgo A, et al. Correlation between myocardial fibrosis and the occurrence of atrial fibrillation in hypertrophic cardiomyopathy: a cardiac magnetic resonance imaging study. Eur J Radiol. 2010; 75: e88– e91 [DOI] [PubMed] [Google Scholar]
- 13. Pintaske J, Martirosian P, Graf H, et al. Relaxivity of gadopentetate dimeglumine (Magnevist), gadobutrol (Gadovist), and gadobenate dimeglumine (MultiHance) in human blood plasma at 0.2, 1.5, and 3 tesla. Invest Radiol. 2006; 41: 213– 221 [DOI] [PubMed] [Google Scholar]
- 14. Secchi F, Di Leo G, Papini GD, et al. Optimizing dose and administration regimen of a high-relaxivity contrast agent for myocardial MRI late gadolinium enhancement. Eur J Radiol. 2011; 80: 96– 102 [DOI] [PubMed] [Google Scholar]
- 15. Kellman P, Arai AE, McVeigh ER, et al. Phase-sensitive inversion recovery for detecting myocardial infarction using gadolinium-delayed hyperenhancement. Magn Reson Med. 2002; 47: 372– 383 [DOI] [PMC free article] [PubMed] [Google Scholar]
- 16. Huber AM, Schoenberg SO, Hayes C, et al. Phase-sensitive inversion-recovery MR imaging in the detection of myocardial infarction. Radiology. 2005; 237: 854– 860 [DOI] [PubMed] [Google Scholar]
- 17. Wildgruber M, Settles M, Kosanke K, et al. Evaluation of phase-sensitive versus magnitude reconstructed inversion recovery imaging for the assessment of myocardial infarction in mice with a clinical magnetic resonance scanner. J Magn Reson Imaging. 2012; 36: 1372– 1382 [DOI] [PubMed] [Google Scholar]
- 18. Ersoy H, Rybicki FJ. Biochemical safety profiles of gadolinium-based extracellular contrast agents and nephrogenic systemic fibrosis. J Magn Reson Imaging. 2007; 26: 1190– 1197 [DOI] [PMC free article] [PubMed] [Google Scholar]
- 19. Masoudi FA, Plomondon ME, Magid DJ, et al. Renal insufficiency and mortality from acute coronary syndromes. Am Heart J. 2004; 147: 623– 629 [DOI] [PubMed] [Google Scholar]
- 20. Frenzel T, Lengsfeld P, Schirmer H, et al. Stability of gadolinium-based magnetic resonance imaging contrast agents in human serum at 37 degrees C. Invest Radiol. 2008; 43: 817– 828 [DOI] [PubMed] [Google Scholar]
- 21. Rofsky NM, Sherry AD, Lenkinski RE. Nephrogenic systemic fibrosis: a chemical perspective. Radiology. 2008; 247: 608– 612 [DOI] [PubMed] [Google Scholar]
- 22. Altun E, Semelka RC, Cakit C. Nephrogenic systemic fibrosis and management of high-risk patients. Acad Radiol. 2009; 16: 897– 905 [DOI] [PubMed] [Google Scholar]
- 23. Reiter T, Ritter O, Prince MR, et al. Minimizing risk of nephrogenic systemic fibrosis in cardiovascular magnetic resonance. J Cardiovasc Magn Reson. 2012; 14: 31. [DOI] [PMC free article] [PubMed] [Google Scholar]
- 24. Sandstede JJ, Beer M, Lipke C, et al. Time course of contrast enhancement patterns after Gd-BOPTA in correlation to myocardial infarction and viability: a feasibility study. J Magn Reson Imaging. 2001; 14: 789– 794 [DOI] [PubMed] [Google Scholar]
- 25. Balci NC, Inan N, Anik Y, et al. Low-dose gadobenate dimeglumine versus standard-dose gadopentate dimeglumine for delayed contrast-enhanced cardiac magnetic resonance imaging. Acad Radiol. 2006; 13: 833– 839 [DOI] [PubMed] [Google Scholar]
- 26. Bauner KU, Reiser MF, Huber AM. Low dose gadobenate dimeglumine for imaging of chronic myocardial infarction in comparison with standard dose gadopentetate dimeglumine. Invest Radiol. 2009; 44: 95– 104 [DOI] [PubMed] [Google Scholar]
- 27. Tumkosit M, Puntawangkoon C, Morgan TM, et al. Left ventricular infarct size assessed with 0.1 mmol/kg of gadobenate dimeglumine correlates with that assessed with 0.2 mmol/kg of gadopentetate dimeglumine. J Comput Assist Tomogr. 2009; 33: 328– 333 [DOI] [PMC free article] [PubMed] [Google Scholar]
- 28. Klein C, Gebker R, Kokocinski T, et al. Combined magnetic resonance coronary artery imaging, myocardial perfusion and late gadolinium enhancement in patients with suspected coronary artery disease. J Cardiovasc Magn Reson. 2008; 10: 45. [DOI] [PMC free article] [PubMed] [Google Scholar]
- 29. Schlosser T, Hunold P, Herborn CU, et al. Myocardial infarct: depiction with contrast-enhanced MR imaging—comparison of gadopentetate and gadobenate. Radiology. 2005; 236: 1041– 1046 [DOI] [PubMed] [Google Scholar]
- 30. Kawel N, Nacif M, Zavodni A, et al. T1 mapping of the myocardium: intra-individual assessment of post-contrast T1 time evolution and extracellular volume fraction at 3 T for Gd-DTPA and Gd-BOPTA. J Cardiovasc Magn Reson. 2012; 14: 26. [DOI] [PMC free article] [PubMed] [Google Scholar]


