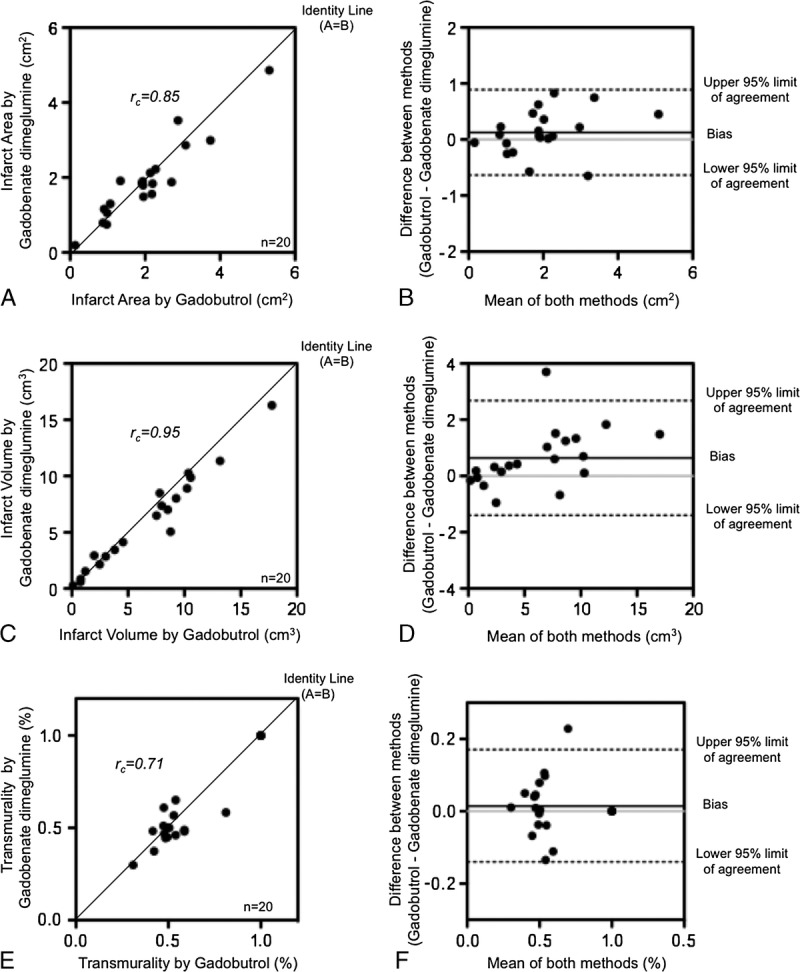
FIGURE 1.

Comparison of the infarct size on MR images, acquired after application gadobutrol and after application of gadobenate dimeglumine. A, The scatter diagram reveals the concordance of the infarct area determined on a selected plane. B, The Bland-Altman plot reveals the limits of agreement and percentage of the mean differences of the infarct areas determined on selected slices. C, The scatter diagram reveals the concordance of the entire infarct volume. D, The Bland-Altman plot reveals the limits of agreement and percentage of the mean differences of the infarct volumes. E, The scatter diagram reveals the concordance of the transmurality of the myocardial infarction. F, The Bland-Altman plot reveals the limits of agreement and the percentage of the mean differences of the transmural extent of the myocardial infarctions.
