
FIGURE 3.
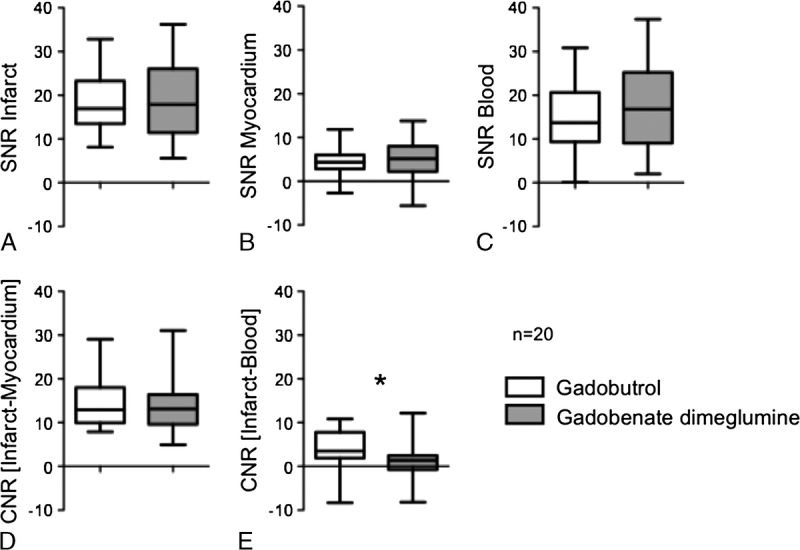
The box plots (horizontal lines by increasing order: minimum, 25%, 50% (median), 75% percentile, maximum) show the distribution of SNR and CNR values for gadobutrol and gadobenate dimeglumine. A, Median values of SNR for myocardial infarction (P = 0.93). B, Median values of SNR of normal myocardium (P = 0.48). C, Median values of SNR for left ventricular blood (P = 0.15). D, Median values of CNRinfarct/myocardium for myocardial infarction and normal myocardium (P = 0.67). E, Median values of CNRinfarct/blood for myocardial infarction and left ventricular blood (P = 0.02). *Statistically significant difference.