FIGURE 3.

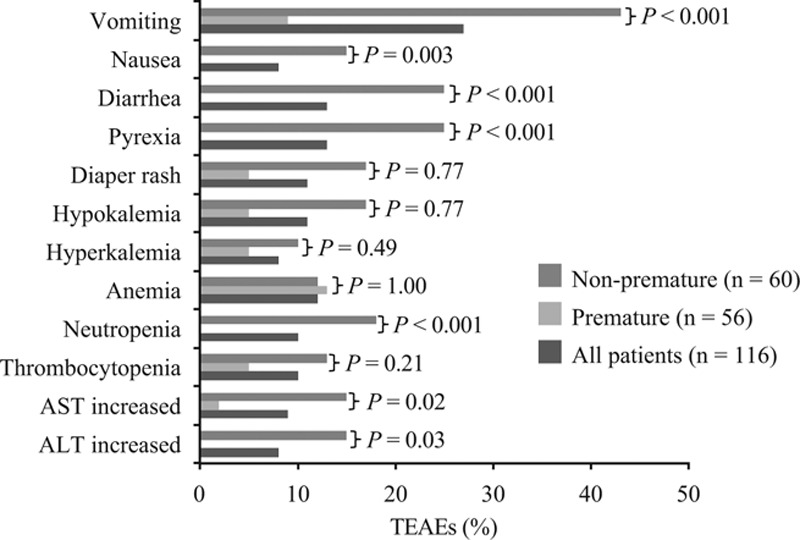
Incidence of TEAEs (>10% in either group) for all patients and for patients by prematurity status. Statistical comparison of non-premature versus premature groups was by Fisher’s exact test.

Incidence of TEAEs (>10% in either group) for all patients and for patients by prematurity status. Statistical comparison of non-premature versus premature groups was by Fisher’s exact test.