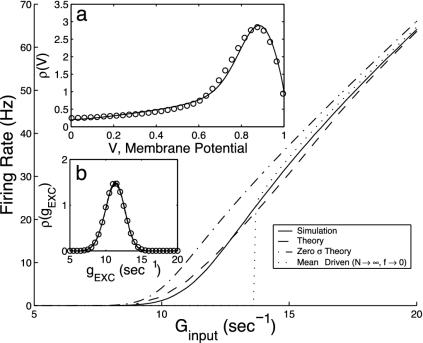
Fig. 2.
Comparison of predictions of the kinetic theory (Eq. 10) with those of full numerical simulation of the I&F network for a single CG patch with N = 300 neurons with the probability of connection between any two cells being 0.25, all excitatory, simple type (σ = 5 ms, τ = 20 ms, S = 0.05, f = 0.01). (a and b)ρ(ν) (ν) and ρ(g) (g), respectively. Solid curves are from I&F simulations and circles from kinetic theory. (c) The average population firing rates per neuron, m,as a function of the average input conductance, Ginput for σ = 5 ms (dashed) and σ = 0 ms (dash-dotted). (See also refs. 3, 5, and 23.)

