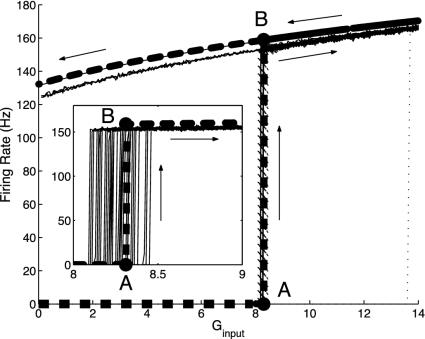
Fig. 3.
Bifurcation diagrams for the firing rate m versus average input conductance Ginput, which compare numerical simulation results with the prediction of the kinetic theory (Eq. 10 in the small σ-limit), for a CG patch containing a small number (N = 16) of excitatory neurons with all-to-all connections (σ = 5 ms, S = 0.45, τref = 3 ms). Theory (thick dashed line) shows lower and upper branches in the bistable region, with a sharp transition from A to B. Simulation results are obtained by slowly “ramping” Ginput, first up, then down. Arrows indicate the results of the simulations with respect to ramping Ginput up and down. (Inset) The transition region for the branch moving up from A to B only, for different realizations of input Poisson spikes. Dotted line (with a jump at Ginput ∼ 13.5) is the prediction of the mean-driven theory.

