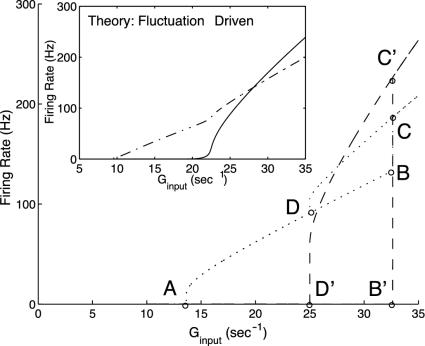
Fig. 4.
Bifurcation diagrams for excitatory firing rate m versus average input conductance Ginput predicted by the kinetic theory for a network, 1/2 of which are simple and 1/2 of which are complex, and 3/4(1/4) of which are excitatory (inhibitory). The large figure displays the large-N limit, and the inset is the finite (N = 75) fluctuation-driven result; in each case, firing curves are shown for both simple (dotted or dash-dotted) and complex excitatory (dash or solid) cells. Note the complicated structure of the mean-driven (N → ∞) case, which results from an interplay between the bifurcations of the simple and complex cells. In more detail: at point A, simple cells reach firing threshold in terms of Ginp, and begin to fire. With increasing Ginp, the firing curve follows A → D → B. At the same time, because of the increasing input from the simple cells, the complex cells reach firing threshold at point B′ in terms of Ginp and abruptly jump from zero firing rate to point C′. Because of this jump, the firing rate of simple cells jumps from B to C. If Ginp is decreased, the firing curve of complex cells follows C′ → D′ and shut off at D′, whereas the simple cells follow the corresponding firing curve, starting from C and revisiting D. With Ginp further decreasing, the simple cells trace the firing curve AD backward to point A and then shut off. The complex cells exhibit a hysteretic loop D′B′C′D′, associated with the hysteretic loop DBCD for the simple cells. (Inset) The much simplified firing-rate diagram for the finite population, fluctuation-driven kinetic theory for the network at this particular cortico-cortical connection strength.

