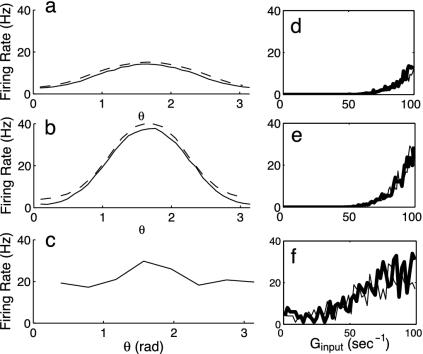
Fig. 7.
Comparison of the firing rate behavior under drifting grating stimuli of three neuronal networks, two ring models and a large-scale I&F 1 mm2 model (21). Each model contains 75% (25%) excitatory (inhibitory) neurons and simple and complex cells. For sample complex neurons, a–c show orientation-tuning curves (firing rate m(θ), where θ denotes the orientation of the drifting grating), comparing the results of the full I&F networks (solid line) with those of the kinetic theory (dashed line); whereas d–f show response diagrams (m(θ) vs. the driving strength). In these response diagrams, heavy bold curves show behavior during “switch-up” of the driving strength, and regular curves depict responses to “switch-down.” (a and d) A ring model of small radius (with neurons near the pinwheel center). (b and e) A ring model of large radius (far from pinwheel center). (c and f) A neuron from the large-scale model that is far from any pinwheel center.

