
FIGURE 1.
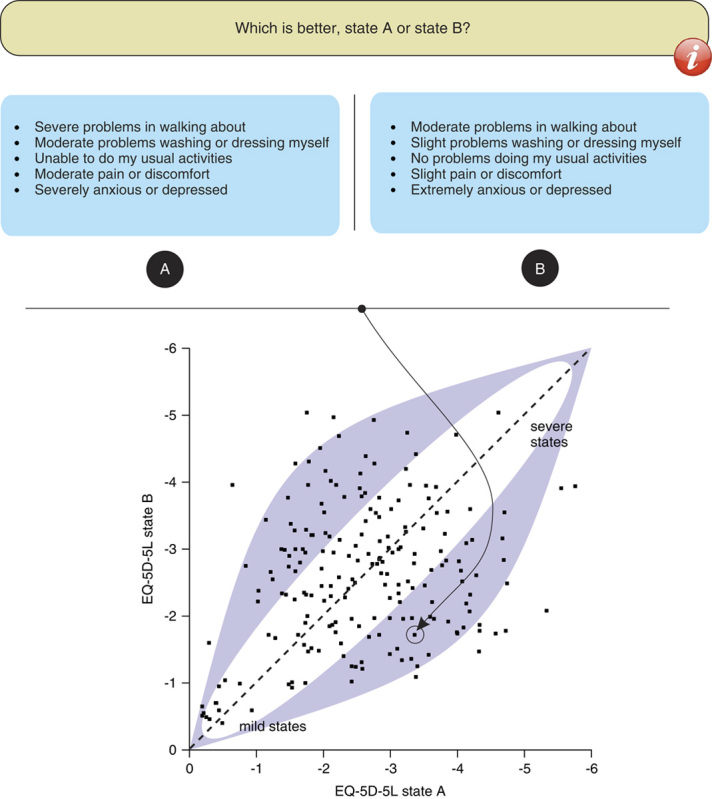
Example of the paired comparison task for the EQ-5D-5L (top) and the localization (based on logistic regression resulting in predictions for all 3125 EQ-5D-5L health states) of this pair (EQ-5D-5L states 43534 vs. 32125) in relation to the other 199 pairs (dashed 45-degree line indicates equal values for state A and B; x-axis and y-axis sorted on predicted values for all 3125 states); dark area roughly represents the combinations of the most informative pairs of health states (approximately 70% vs. 30% preferred by respondents), around diagonal (50% vs. 50%) and in the 2 corners (approximately 90% preference for one of the 2 health states) the noninformative pairs.