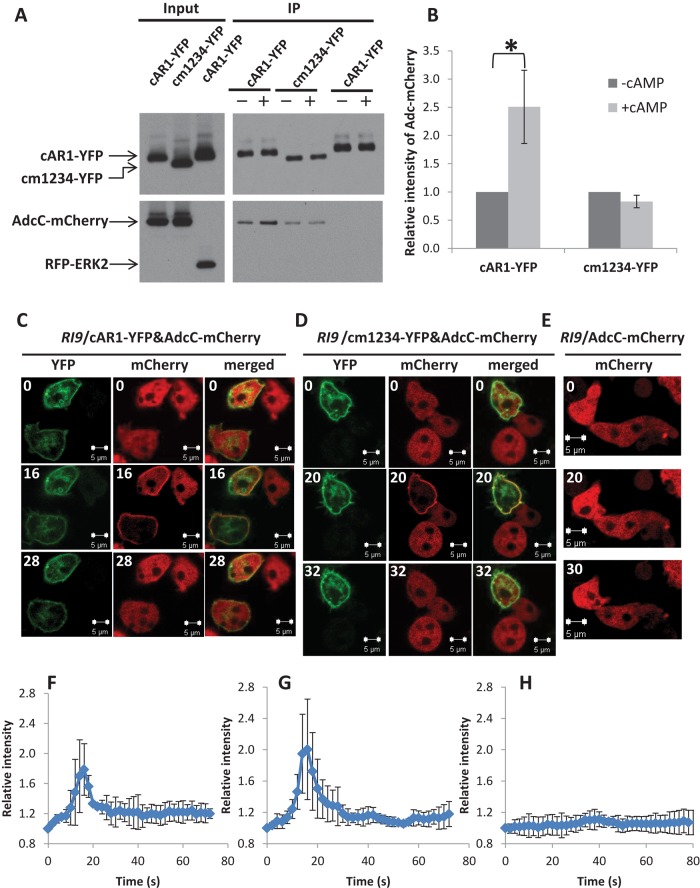
FIGURE 3:
cAR1 associates with AdcC. (A, B) RI9 (car1-/car3-) cells coexpressing AdcC-mCherry and cAR1-YFP, AdcC-mCherry, and cm1234-YFP or RFP-ERK2 and cAR1-YFP were stimulated with 0 or 50 μM cAMP (– or +, respectively). Membrane fractions were collected at 16 and 20 s, respectively, and lysates were incubated with beads coupled with anti-GFP antibody. Elutes were analyzed by immunoblotting using anti-GFP to detect cAR1-YFP or cm1234-YFP (top) and anti-RFP to detect AdcC-mCherry or RFP-ERK2 (bottom). Five percent of the total lysates were reserved to show input levels. Band intensities of AdcC-mCherry in A were measured by ImageJ and normalized with the amounts of cAR1-YFP or cm1234-YFP in each sample. Results represent the mean ± SD of three independent experiments. Statistical significance was assessed by t test, *p < 0.05. (C–E) RI9 cells coexpressing AdcC-mCherry and cAR1-YFP (C) or cm1234-YFP (D) were stimulated with 10 μM cAMP. Cells expressing AdcC-mCherry alone were stimulated similarly (E). Images were captured at 2-s intervals by confocal microscopy; selected time points in the YFP and mCherry channels are shown. The intensity of mCherry in the plasma membrane was measured and normalized to time 0 and is defined as 1. The kinetics of the time courses of C–E are graphed in F–H, respectively. Means (n = 3, 4) and SDs are shown. Scale bar, 5 μm.

