
FIGURE 1. TRPMLs interact with each other to form multimers.
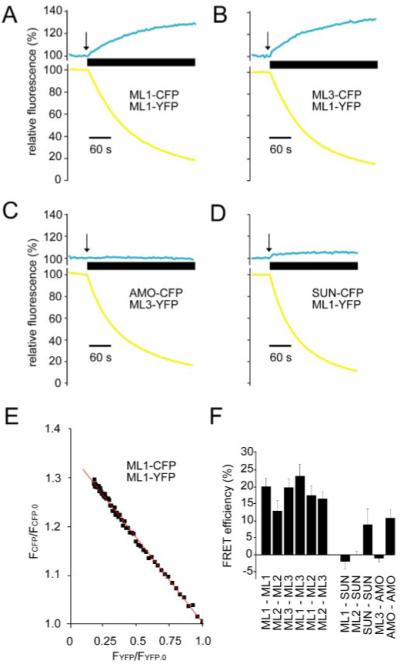
A, representative traces showing FRET between TRPML1-YFP and TRPML1-CFP. Changes in the relative fluorescence (percent) of CFP and YFP emissions are plotted against time (seconds). The thick horizontal bar denotes the duration of application of acceptor-photobleach, the initiation of the photobleach is indicated by the arrow. A 60-s scale bar is shown. B, FRET between TRPML1-YFP and TRPML3-CFP. C, representative traces demonstrating absence of FRET between TRPML3-YFP and AMO-CFP. D, absence of FRET between TRPML1-YFP and Sun-CFP. E, representative linear regression analysis of fractional donor (TRPML1-CFP) recovery (FCFP/FCFP.0) versus fractional acceptor (TRPML1-YFP) photobleach (FYFP/FYFP.0). F, bar graph showing the FRET efficiencies (percentage) between the various pairs of proteins as indicated along the x axis. Averages are results of three to five separate experiments in each case, and error bars indicate S.E.