
FIGURE 2. Subcellular localizations of TRPML1 and TRPML2.
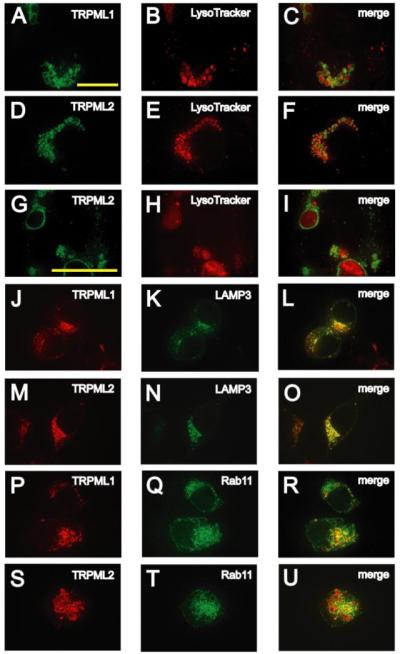
A and B, confocal images of fixed HEK293 cells that were transfected with TRPML1-YFP, loaded with LysoTracker-Red (100 nm) and viewed at the indicated excitation wavelengths. A, 488 nm, TRPML1-YFP, green; B, 568 nm, Lyso-Tracker-Red, red. C, merge of A and B. D–F, same as A–C but in HEK293 cells transfected with TRPML2-YFP. G–I, same as D–F but at 1.6× higher magnification. J and K, confocal images of HEK293 cells co-transfected with TRPML1-HA and LAMP3-YFP in which immunofluorescence was performed with anti-HA primary antibodies and Alexa568-conjugated secondary antibodies and viewed at the indicated excitation wavelengths: 568 nm, TRPML1-HA, red (J) and 488 nm, LAMP3-YFP, green (K). L, merge of J and K. M–O, same as J–L but in HEK293 cells cotransfected with TRPML2-HA and LAMP3-YFP. P–R, same as J–L but in HEK293 cells cotransfected with TRPML1-HA and GFP-Rab11. S–U, same as J–L but in HEK293 cells co-transfected with TRPML2-HA and GFP-Rab11. The scale bar shown in A is applicable to all the panels except G–I, which utilize the scale bar shown in G. All scale bars represent 20 μm.