
FIGURE 4. Translocation of TRPML3 to lysosomes as a result of coexpression with either TRPML1 or TRPML2.
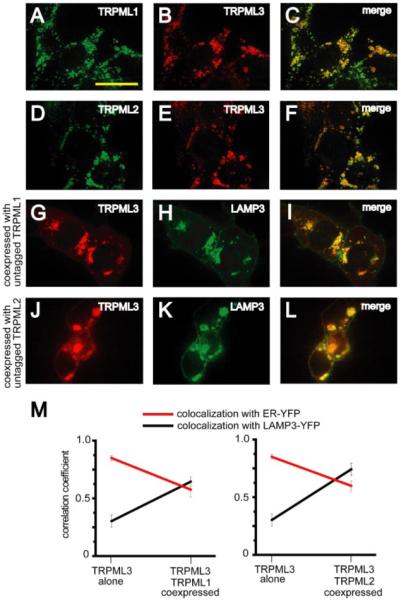
A and B, confocal images of HEK293 cells cotransfected with TRPML1-HA and TRPML3-MYC. Immunofluorescence was performed with anti-HA primary/Alexa488-conjugated secondary and anti-MYC primary/Alexa568-conjugated secondary antibodies at the indicated excitation wavelengths: 488 nm, TRPML1-HA, green (A); 568 nm, TRPML3-MYC, red (B). C, merge of A and B. D–F, same as A–C but in HEK293 cells co-transfected with TRPML2-HA and TRPML3-MYC. G–I, confocal images of HEK293 cells cotransfected with TRPML3-HA, untagged TRPML1, and LAMP3-YFP. Immunofluorescence was performed with anti-HA primary antibodies and Alexa568-conjugated secondary antibodies at the indicated excitation wavelengths: 568 nm, TRPML3-HA, red (G); 488 nm, LAMP3-YFP, green (H). I, merge of G and H. J–L, same as G–I but in HEK293 cells cotransfected with TRPML3-HA, untagged TRPML2, and LAMP3-YFP. Scale bar represents 20 μm. M, quantification of decrease in ER localization (red) and an increase in lysosomal localization (black) of TRPML3 when coexpressed with either TRPML1 (left) or TRPML2 (right). Averages are based on three to five separate experiments in each case, and error bars indicate S.E.