
FIGURE 5. Subcellular localizations of TRPMLs in NIH3T3 cells.
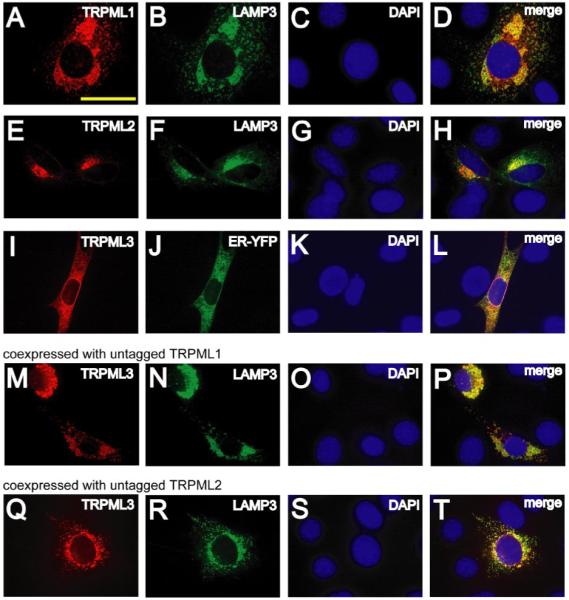
A–C, confocal images of DAPI-loaded NIH3T3 cells co-transfected with TRPML1-HA and LAMP3-YFP in which immunofluorescence was performed with anti-HA primary antibodies and Alexa568-conjugated secondary antibodies and viewed at the indicated excitation wavelengths: 568 nm, TRPML1-HA, red (A); 488 nm, LAMP3-YFP, green (B); 360 nm, DAPI, blue (C). D, merge of A–C. E–H, same as A–D but in DAPI-loaded NIH3T3 cells co-transfected with TRPML2-HA and LAMP3-YFP. I–L, same as A–D but in DAPI-loaded NIH3T3 cells co-transfected with TRPML3-HA and ER-YFP. M–O, confocal images of DAPI loaded NIH3T3 cells previously co-transfected with TRPML3-HA, untagged TRPML1, and LAMP3-YFP. Immunofluorescence was performed with anti-HA primary antibodies and Alexa568-conjugated secondary antibodies at the indicated excitation wavelengths: 568 nm, TRPML3-HA, red (M); 488 nm, LAMP3-YFP, green (N); 360 nm, DAPI, blue (O). P, merge of M–O. Q–T, same as M–P but in DAPI-loaded NIH3T3 cells co-transfected with TRPML3-HA, untagged TRPML2, and LAMP3-YFP. Scale bar represents 20 μm.