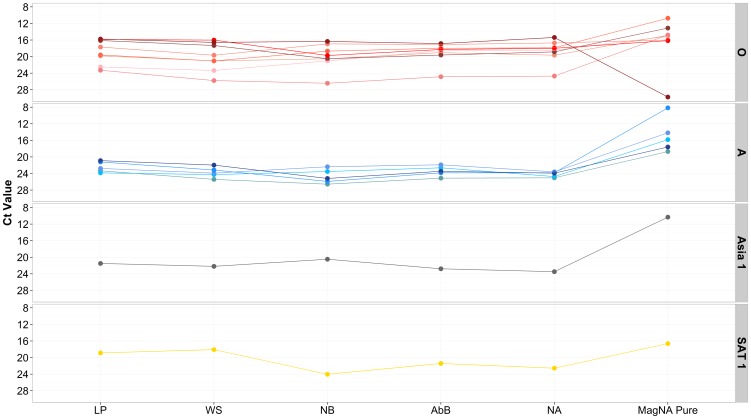
Figure 2. Ct values generated from FMDV 3D rRT-PCR performed on sections of 14 separate LFDs and corresponding values generated for MagNA pure extracted RNA from the equivalent original epithelial suspensions in parallel.
LP: Loading Pad; WS: Wicking strip; NB: Nitrocellulose below Ab Band (NB); Nitrocellulose Ab Band (AbB); Nitrocellulose above Ab band (NA). LFDs spanned four serotypes O (red dots) (LFDs TUR 8/1969, BAR 2/2008, KUW 2/2008, SAU 3/2008, ZAM 5/2008, HKN 10/2005, IRN 53/2006, UKG 7B/2007, A (blue dots) (LFDs BAR 4/2009, IRN 1/2008, KEN 8/2008, TUR 20/2006, IRN 36/2007), Asia 1 (grey dots) (IRN 15/2001) and SAT 1 (yellow dots) (ZAM 5/2008).

