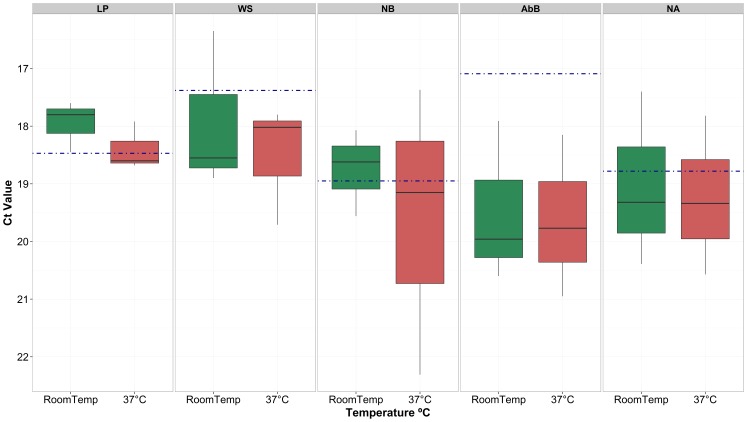
Figure 4. Box plot of Ct values generated from FMDV 3D rRT-PCR performed on sections of LFDs from serotype SAT 1 isolate (ZAM 5/2008) eluted at one month after LFD testing.
LFDs had either been stored at room temperature (RoomT) (green bar) or 37°C (red bar). LP: Loading Pad; WS: Wicking strip; Nitrocellulose Ab Band (AbB). Dotted blue line represents baseline data (Ct values from LFDs washed on day one).

