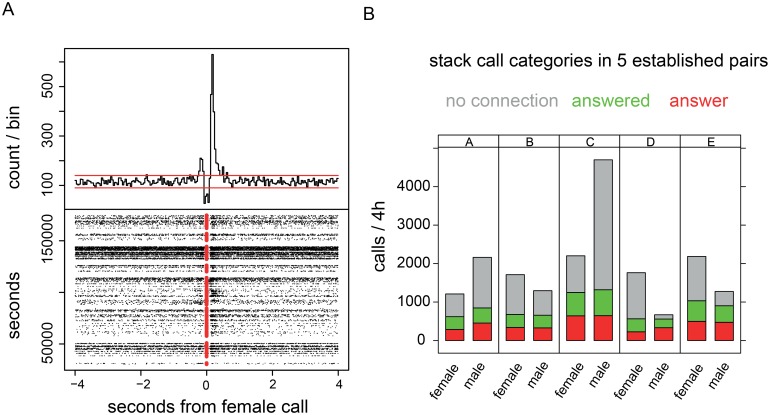
Figure 2. The detailed relationships between stack calls produced by pairs of zebra finches.
A. The temporal relationship is shown as a peristimulus-time-histogram (PSTH; upper graph), where the onset times of the male calls are aligned to the onset times of the female calls. The horizontal lines in the PSTH are the 1% confidence intervals. In the raster diagram (lower panel) the female calls are shown as red dots. Each male call is represented by a black dot. The probability of male stack calls occurring within half a second before or after the female stack is clearly and significantly increased. Data from one pair kept in a soundbox: 8472 male stacks and 11047 female stacks were recorded in a 35 h period (5 days with 7 h of recording each, starting at 8∶00 AM). Binwidth is 100 msec. B. Relative contributions of calls that were answered, were an answer, or were not connected to any stack call of the partner. Data from 5 established pairs.

