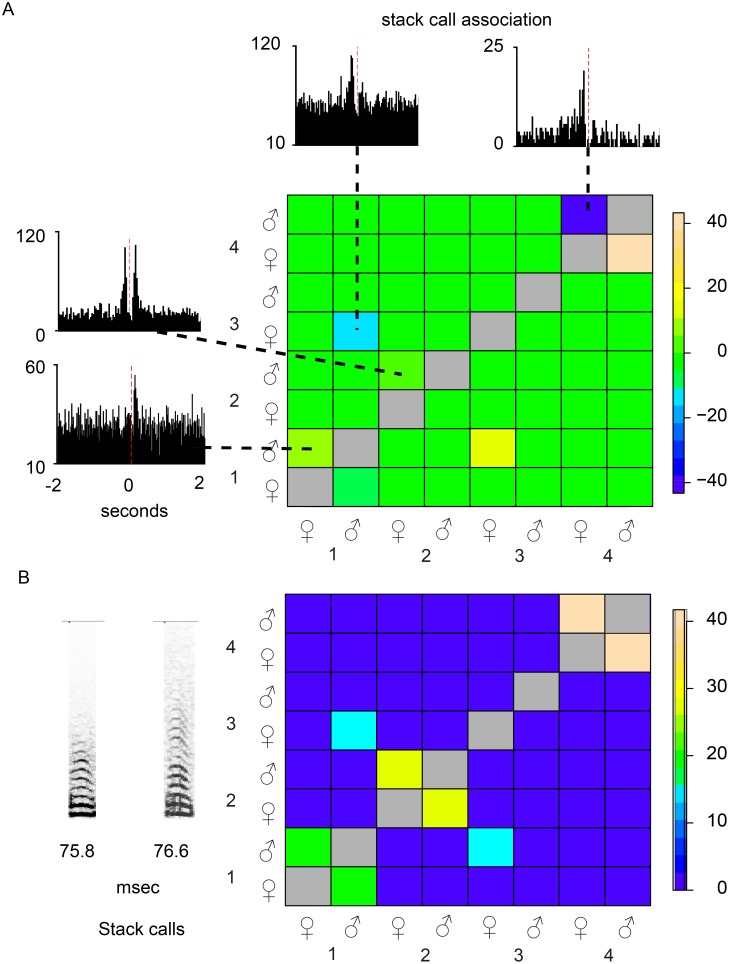
Figure 3. Charting calling relationships in a group.
Four pairs of zebra finches. Based on the PSTH, metrics were calculated to describe the strength of the correlation between stack calls. The calls were recorded with carry-on microphones. Indicated in the upper matrix (A) are the PSTH’s from which the metrics were calculated. The animals to whose calls the PSTH’s were aligned are indicated along the left vertical side of the matrix. The animals whose calls were counted in the histograms are indicated along the bottom of the matrix. The lower matrix (B) shows the strength of the relationship regardless of symmetry. The matrix shows different possible calling relationships. For instance, pair 4 and pair 2 do not call with any other animal in the aviary. In contrast, the male of pair 1 is answered not only by the female of pair 1, but also by the female of pair 3. The partners of pair 3 are the only pair that did not interact at all in our experiments with groups. The associations of the callers with themselves are grayed out because they represent autocorrelations, whereas all the others are cross-correlations. Two sonograms of stack calls are shown in panel B. Duration in msec is shown underneath the sonograms.

