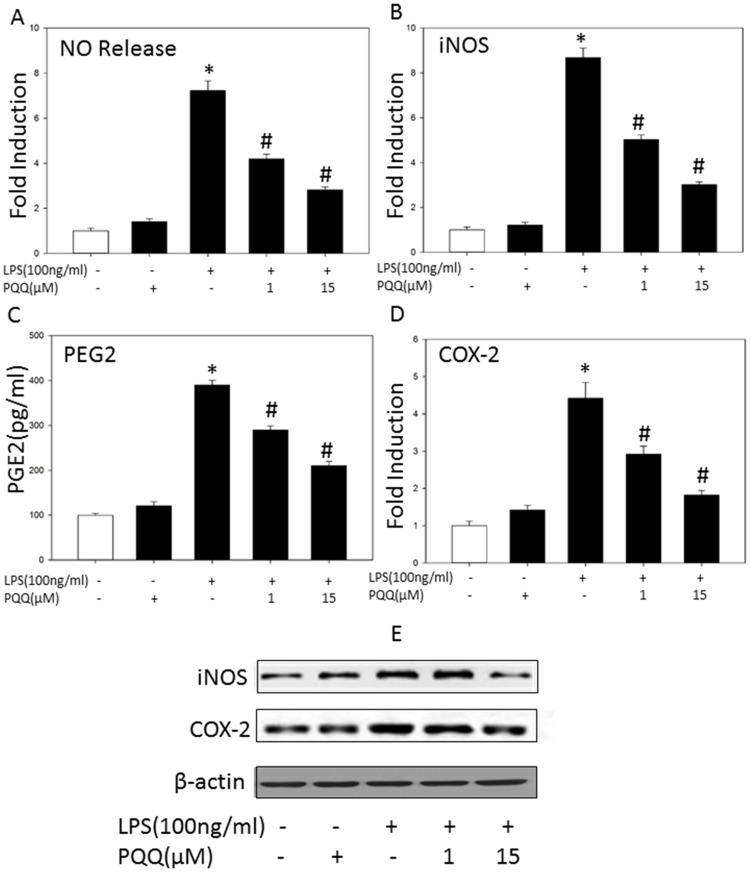
Figure 2. Effects of PQQ on LPS-induced NO, PGE2 production and iNOS, COX-2 expression in microglia cells.
Primary microglia were pretreated with or without PQQ for 1 h followed by LPS (100 ng/ml) treatment for indicated durations. Culture supernatants were collected 24 h later, the released NO in primary microglia (A) was determined by the Griess assay, total mRNA was harvested 6 h later, and the mRNA level of iNOS (B) and COX-2 (D) was measured by real-time PCR. (C) Concentrations of PGE2 in the culture supernatants of primary microglia were determined by ELISA. (E) 24 h later, the protein level of iNOS and COX-2 were detected by western blot analysis in primary microglia cells. The results presented as mean ± S.E.M. of at least three independent experiments, *p<0.05 vs. control group, #p<0.05 vs. only LPS group.

