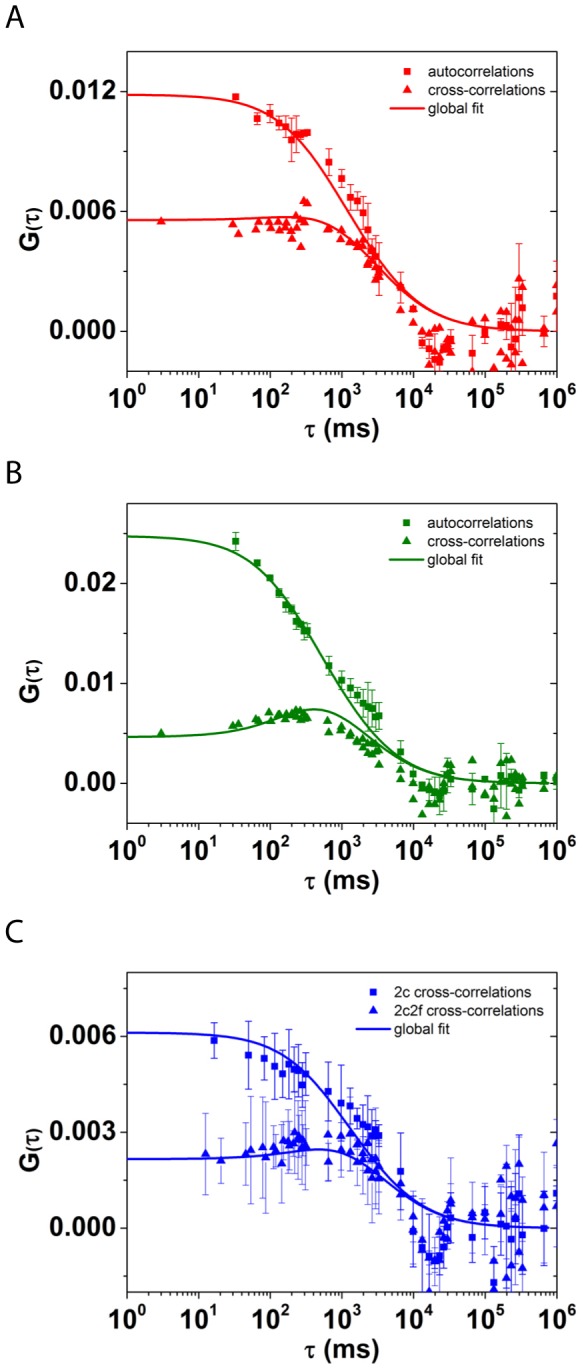
Figure 3. Fluorescence intensity correlation functions.

A) Auto- and dual-focus cross-correlation functions in the red channel show ROR2-mCherry diffusion within the plasma membrane. B) Auto- and dual-focus cross-correlation functions in the green channel show the mobility of Xwnt5A-EGFP at the membrane. C) Cross-correlation functions of the green and red channels, reveal concerted diffusion and, therefore, binding of Xwnt5A-EGFP to ROR2-mCherry.
