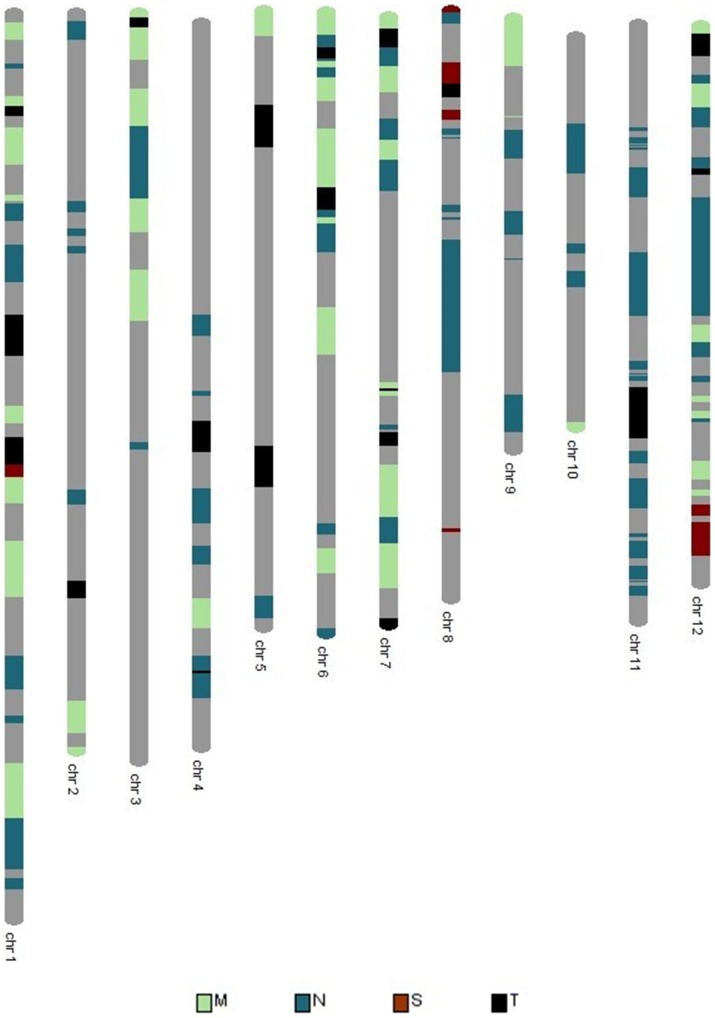
Figure 2. Physical map of markers showing segregation distortion, known genes for disease resistance in rice, and QTLs reported for blast resistance in the Moroberekan/CO39 population.
M = markers showing distortion in favour of Moroberekan, S = markers showing distortion in favour of Swarna, N = genes coding for NBS-LRR proteins, and T = QTLs reported for blast resistance in the Moroberekan/CO39 population.

