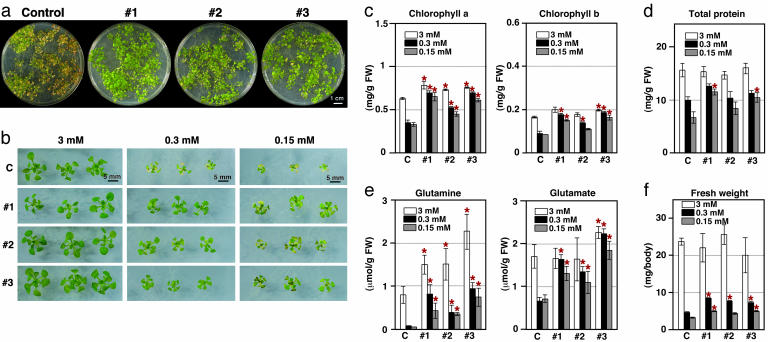
Fig. 4.
Effects of Dof1 on Arabidopsis growth under the low-nitrogen conditions. (a) The phenotypes of the control plants and transgenic Dof1 plants when they were grown on a plate containing 1 mM NH4NO3 and 1 mM KNO3 with a density of ≈200 plants per plate. (b) The phenotypes of the 3-week-old plants grown with a density of 21 plants per plate. We used the plates containing 3 mM nitrogen (1 mM NH4NO3 and 1 mM KNO3), 0.3 mM nitrogen (0.1 mM NH4NO3 and 0.1 mM KNO3), or 0.15 mM nitrogen (0.05 mM NH4NO3 and 0.05 mM KNO3). The chlorophyll a and b contents (c), the protein concentration (d), the concentrations of glutamine and glutamate (e), and fresh weight (f) were compared with control plants (bar C) and the transgenic lines (bars 1–3). Values are the mean ± SD of three independent samples. Asterisks indicate that the difference between the control plants and the Dof1 transgenic plants was significant by the t test (P < 0.05).

