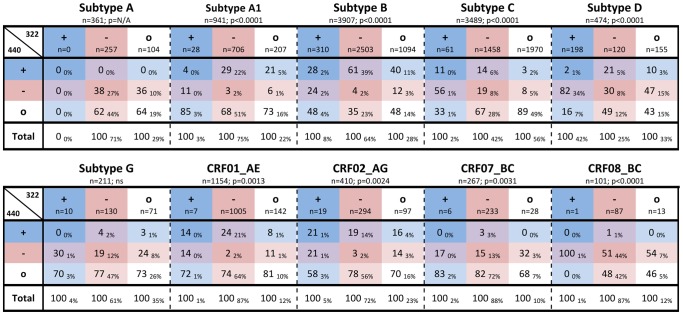
Figure 4. Analysis of covariance of charged amino acids at Env positions 322/440 in non-B subtype HIV-1 strains.
Values represent the percentage of Envs within each subtype that have the indicated type of amino acid (+, positively charged; -, negatively charged; o, neutral) at position 440 out of all Envs with the indicated type of amino acid at position 322. Subscript values represent the percentage of Envs within each subtype that have the indicated combination of amino acid types at positions 322/440. Amino acids are colored according to charge, as described in the legend for Figure 1. P-values were calculated by chi-square analysis (ns, not significant; N/A, not applicable).

