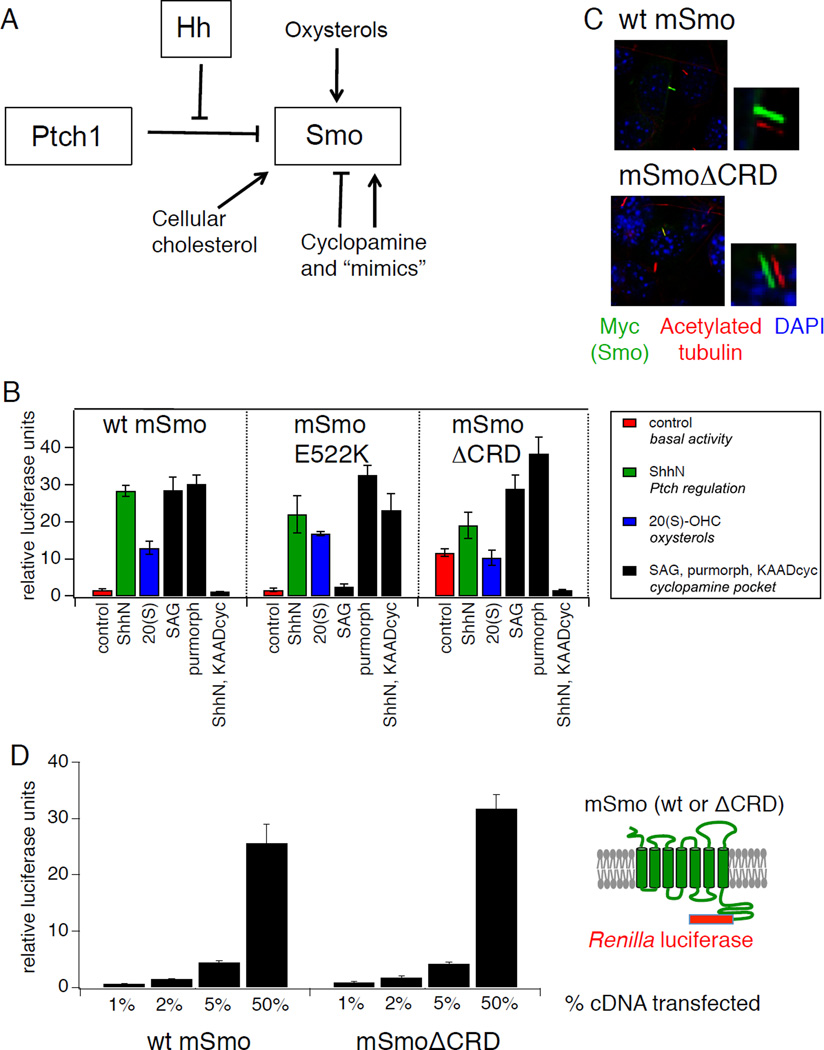
Figure 1.
Distinct structural determinants required for regulation of Smo by Ptch and by endogenous and exogenous ligands. (A) Schematic diagram of Hh pathway components showing multiple regulatory mechanisms that impinge on Smo, including Hh antagonism of Ptch-mediated suppression, direct modulation by cyclopamine and related small molecule agonists and antagonists, activation by oxysterols, and a requirement for cholesterol. (B) Luciferase activity in Smo−/− mouse embryonic fibroblasts (MEFs) cotransfected with Gli-luciferase reporter plasmids and cDNAs encoding wild-type (wt) mSmo or the E522K or ΔCRD mutants following treatment with: control or ShhN conditioned medium (red and green bars, respectively); 20(S)-OHC (10 µM, blue bars); SAG (200 nM), purmorphamine (2.5 µM), or ShhN conditioned medium with KAAD-cyclopamine (KAADcyc, 300 nM) (black bars). Error bars represent standard deviations (n = 3 independent transfections per data point). A summary of the experiment is shown; complete data set is presented in Fig. S1A. (C) Ciliary localization of Myc-tagged wt or ΔCRD Smo constructs was examined in fixed NIH3T3 cells stained with antibodies against acetylated tubulin (red) or the Myc epitope (green); nuclei were visualized with DAPI (blue). Small panels to the right of selected images display shifted overlays of the acetylated tubulin and Myc channels. See Fig. S1B for quantification. (D) Quantification of wt Smo and Smo ΔCRD protein in transfected Smo−/− MEFs over a range of expression levels using Cterminal fusions to Renilla luciferase. X-axis indicates % of Smo cDNA transfected into each well, while Y-axis indicates Renilla measurement, normalized to a control secreted alkaline phosphatase (SEAP) construct; replicates and error bars are as in panel (B). See also Figure S1 and Table S1.

