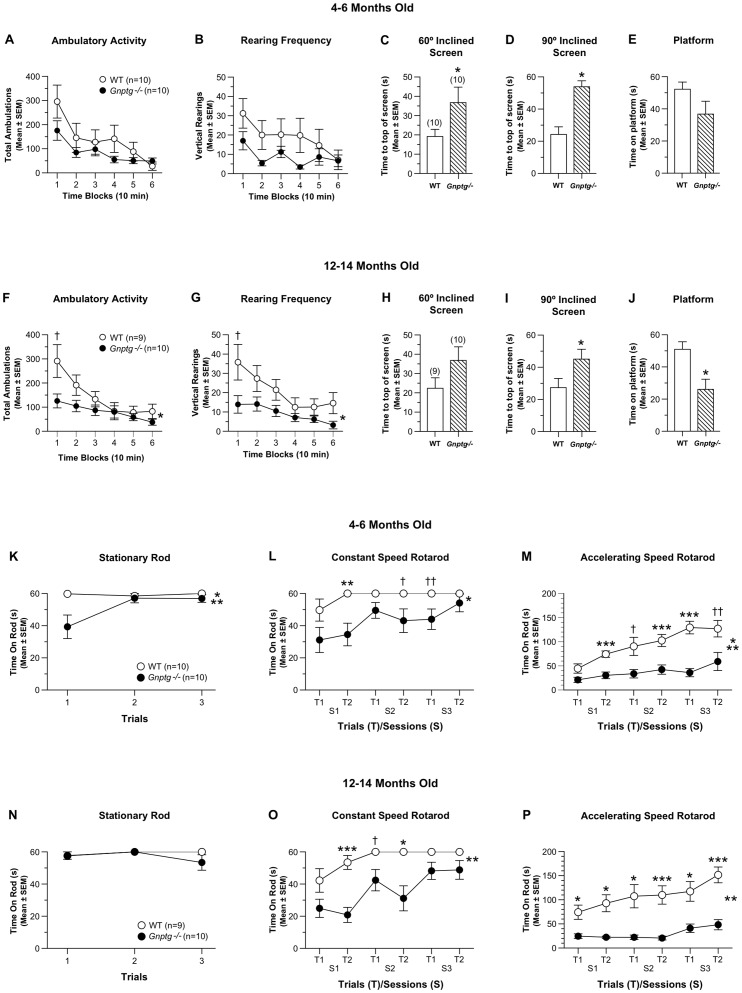
Figure 3. Gnptg−/− mice show mild to moderate performance deficits on activity, sensorimotor and rotarod tests.
(A-B) Although the Gnptg−/− mice tended to show lower levels of ambulatory activity (A) and vertical rearing frequency (B) relative to WT littermate controls on the 1-h locomotor activity test when tested at 4–6 months of age, no significant effects involving genotype were found following analyses conducted on these data. However the Gnptg−/− group took significantly longer to climb to the top of the 60° (C) and 90° (D) inclined screens, (genotype effects: *p = 0.0005 and 0.0001, respectively), and showed a nonsignificant trend toward being able to remain on the platform for a shorter time compared to WT control mice (E) when tested at this age (see Fig. 3B for details of sex effects on the 60° inclined screen). (F) When the 1-h activity test was conducted at 12–14 months of age, the Gnptg−/− mice tended to be less active compared to controls, although this depended on the time block of the test session (genotype x time interaction: *p = 0.012), with the largest group differences being observed during the first time block (†p = 0.041). (G) At this age, the Gnptg−/− group also showed significantly reduced rearing frequency on average across time blocks, (genotype effect: *p = 0.043), with the largest differences occurring during the first block (†p = 0.049). (H) During testing at 12-14 months of age, the performance level of the Gnptg−/− mice tended to be much lower than that of the WT control group on the 60° inclined screen, but the differences were not statistically significant. However, the Gnptg−/− mice did show significant performance deficits at this age on the 90° inclined screen (I) and platform tests (J), (genotype effects: *p = 0.026 and *p = 0.010, respectively). The Gnptg−/− strain was also impaired on the rotarod when tested at 4–6 months of age. (K) For example, a significant genotype effect (*p = 0.024) indicated that the Gnptg−/− mice were impaired on the stationary rod component of the rotarod although this effect was mostly due to differences observed during trial 1 (††p = 0.007), whereas their performance on the other two trials were similar to those of the WT group (see Fig. 3C for details of sex effects). (L) The Gnptg−/− group also exhibited significant performance impairments on the constant speed rotarod on average across trials and sessions (genotype effect: *p = 0.005), with group differences being significant for session 1 - trial 2 (**p = 0.004), while large differences were also observed for session 2 - trial 2 (†p = 0.044) and session 3 - trial1 (††p = 0.019). (M) Analysis of the accelerating rotarod data also revealed significant performance deficits on the part of the Gnptg−/− mice (genotype effect: **p = 0.0003; genotype x sessions interaction: *p = 0.002), although this was somewhat dependent on the sessions variable. Pair-wise comparisons showed that group performances differed significantly for session 1 - trial 2, session 2 - trial 2, and session 3 - trial 1 (***p <0.0009), while large differences were observed for session 2 - trial 1 (†p = 0.012) and session 3 - trial 2 (††p = 0.009). (See Fig. 3D for details concerning sex effects.) When the mice were re-tested at 12-14 months, the groups were found to perform similarly on the stationary rod (N). However, the Gnptg−/− group again showed significant deficits on the constant speed rotarod (O) which was documented by a significant genotype effect (**p = 0.0003). Pair-wise comparisons showed that the Gnptg−/− mice had significantly reduced times on the rod for session 1 - trial 2 (***p = 0.0003) and session 2 - trial 2 (*p = 0.004), with large differences also being found for session 2 - trial1 (†p = 0.033). (P) The Gnptg−/− group was also significantly impaired again on the accelerating rotarod when re-tested at the later age, (genotype effect: **p = 0.0001) when pair-wise comparisons showed significant group differences across all trials and sessions (*p <0.008; ***p <0.0005) (see Fig. 3E for details of sex effects).

