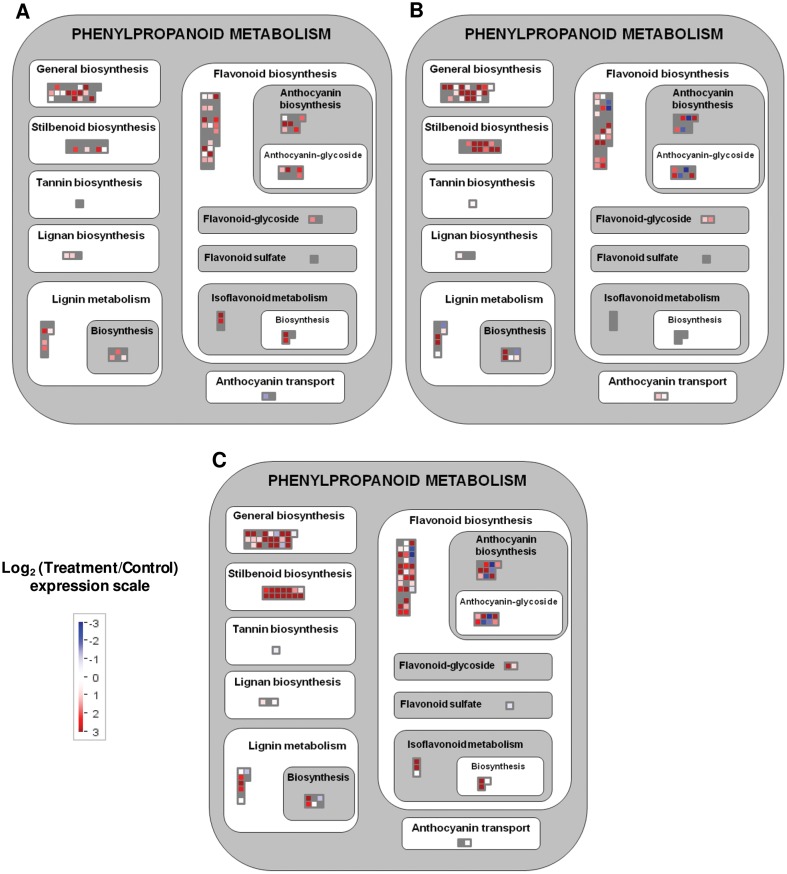
Figure 4. Mapman visualization of the significant genes in the ‘Phenylpropanoid metabolism’ pathway.
A, MJ (methyl jasmonate); B, CD (cyclodextrins); C, CDMJ (cyclodextrins and methyl jasmonate). Resultant transcripts were considered after the average of significant redundant probesets expression values. Significant probesets according to a 5% FDR and P-value <0.05 for model variable in the corresponding control versus treatment 24 h series maSigPro comparison. Expression changes in the treatment normalized to these in the control are shown. Red, treatment up-regulated transcripts; blue, treatment down-regulated transcripts; grey, transcripts not significant in the treatment.

