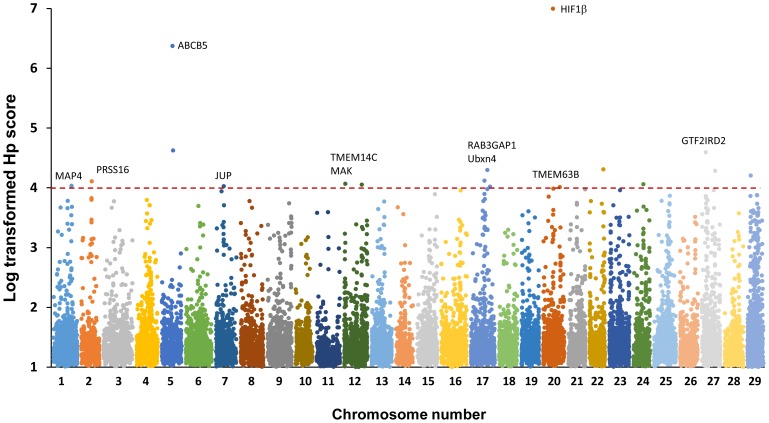
Figure 5. Genome-wide distribution of log-transformed pooled heterozygosity (Hp) values.
The x-axis represents the positions of windows (20 Kb) along each chromosome, which is represented with different colors. The y-axis represents the Hp scores transformed by –log2. Windows of HIF-1β had the Hp score of 0, therefore, its transformed Hp score was defined as 7, the maximum score, for the convenience of plotting.

