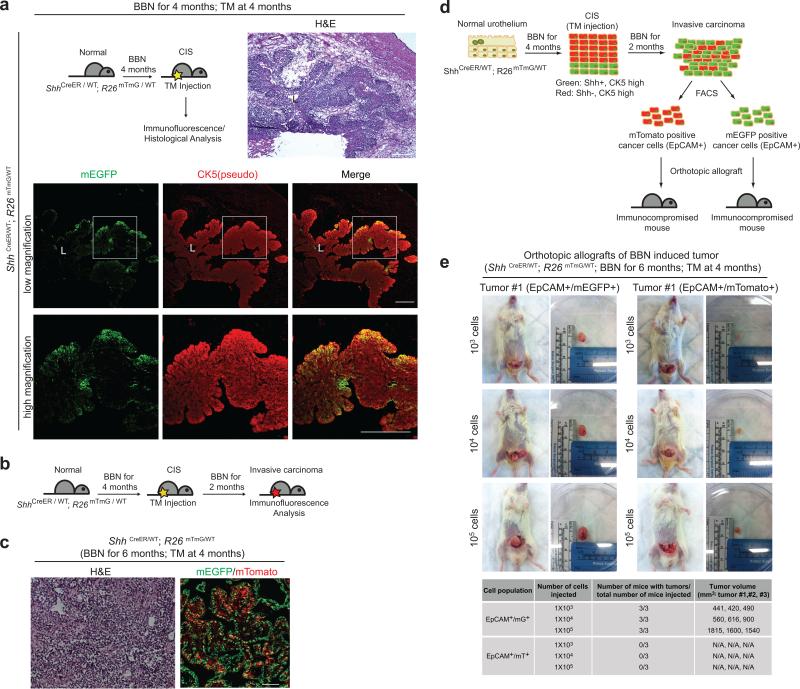
Figure 5. Shh-positive and -negative cells in the CIS lesion contribute to invasive carcinoma, but tumor-propagating cells derive exclusively from Shh-positive cells.
(a) Experimental scheme (top left panel) to label Shh-expressing cells in the CIS lesion. Following 4 months of BBN exposure to induce CIS, ShhCreER;R26mTmG mice were injected with TM on three consecutive days to label Shh-expressing cells prior to sacrifice. Bladder tissues were analyzed by H&E staining (top right panel) or by immunostaining for mG and CK5 (green and red, respectively). Lower panels show magnified views of the regions highlighted by white boxes in panels immediately above. (b) Experimental scheme for marking of Shh-positive and -negative cells in CIS lesions, and to track them into carcinoma formation. (c) ShhCreER; R26mTmG mice exposed to BBN for 4 months and injected with TM on three consecutive days, were subsequently exposed to BBN for two more months. Invasive carcinomas from these animals were analyzed by H&E staining (left panel) or for expression of mG or mT, which respectively marks cells that expressed (green) or did not express (red) Shh at the time of TM injection. (d) Experimental scheme to determine tumor-propagating ability of carcinoma cells. mG/EpCAM-positive and mT/EpCAM-positive cells from invasive carcinomas generated as described in (b) were isolated by FACS and transplanted intramurally into the dome of the bladder. (e) Orthotopic transplantation with serial dilutions of mG/EpCAM-positive and mT/EpCAM-positive cells from a single tumor. Results of transplantations from three different tumors, summarized below, show that only Shh-expressing cells in the CIS lesion will subsequently become tumor-propagating cells in transplantation experiments. L, bladder lumen. Repeated experimental results for (a) and (e) are shown in Supplementary Figure 5a and 5d, respectively. Scale bars, 50μm.

