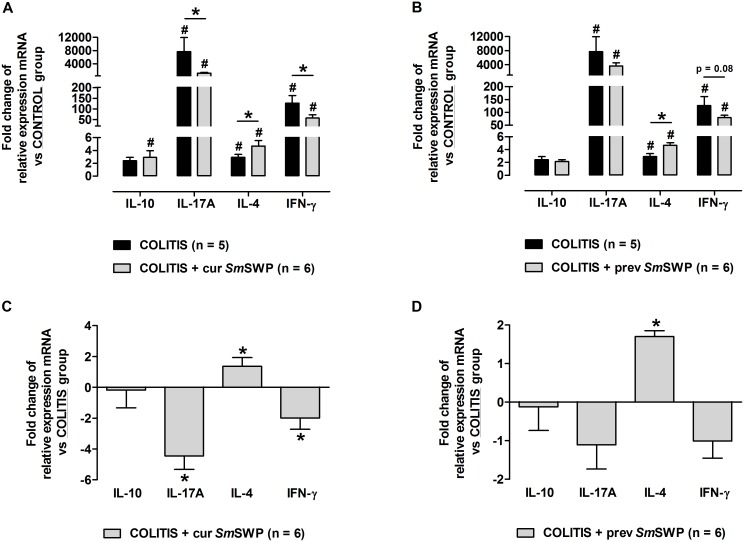
Figure 6. Fold changes of the relative mRNA expression of colonic IL-10, IL-17A, IL-4 and IFN-γ.
(A) and (C) represent the curative set-up of SmSWP treatment, (B) and (D) represent the preventive set-up of SmSWP treatment. In (A) and (B), data are expressed as the fold change of relative mRNA expression and the CONTROL group was chosen as calibrator. In (C) en (D), data are expressed as the fold change of relative mRNA expression and the COLITIS group was chosen as calibrator. Data are presented as mean ± SEM. One-way ANOVA with LSD post-hoc test or an unpaired Student’s t test was used as an appropriate approach to compare the real-time PCR data between groups. #: P≤0.05, significantly different from CONTROL group; *: P≤0.05, significant difference between the COLITIS and COLITIS+SmSWP groups; “n” representing the number of mice. Abbreviations: cur: curative; IFN-γ; interferon-γ, IL: interleukin; LSD: least significant difference; mRNA: messenger ribonucleic acid; PCR: polymerase chain reaction; prev: preventive; SEM: standard error of the mean; SmSWP: Schistosoma mansoni soluble worm proteins.

