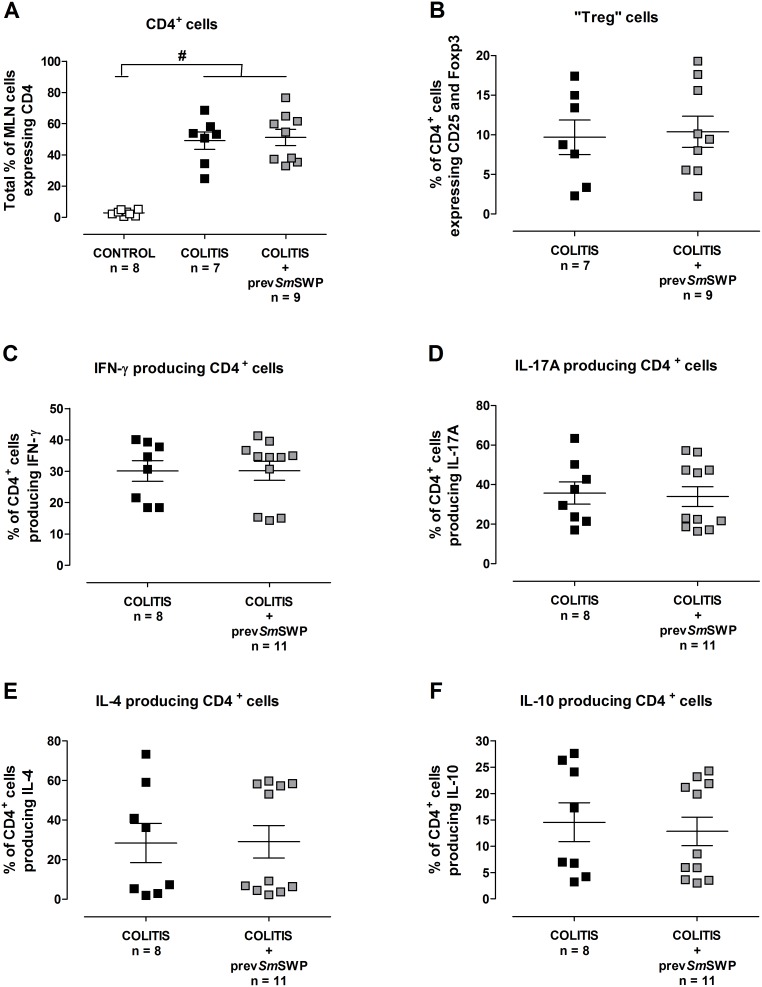
Figure 9. Flow cytometric T cell characterization of the MLN cells after preventive SmSWP treatment.
Total % of CD4+ cells (A), % of CD4+ cells expressing CD25 and Foxp3 (probably Treg cells) (B), % of CD4+ cells producing IFN-γ (C), % of CD4+ cells producing IL-17A (D), % of CD4+ cells producing IL-4 (E) and % of CD4+ cells producing IL-10 (F). Data are presented as mean ± SEM. One-way ANOVA with LSD post-hoc test or an unpaired Student’s t test was used as an appropriate approach to compare the flow cytometric results between groups. #: P≤0.05, significantly different from CONTROL group; “n” representing the number of mice. Abbreviations: CD: cluster of differentiation; Foxp3: forkhead box p3; IFN-γ: interferon-γ; IL: interleukin; LSD: least significant difference; MLN: mesenteric lymph nodes; %: percentage; prev: preventive; SEM: standard error of the mean; SmSWP: Schistosoma mansoni soluble worm proteins.

