
Figure 2.
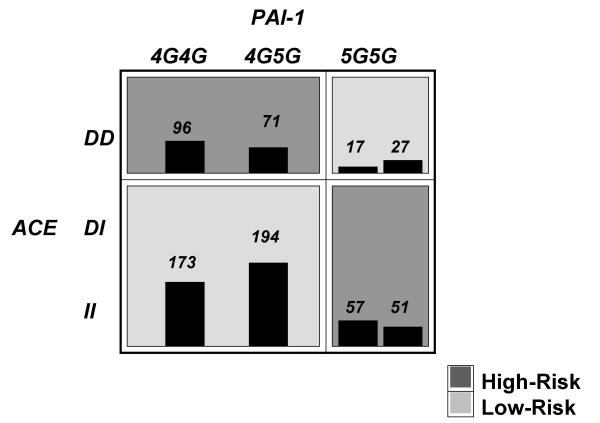
Summary of two-locus ACE I/D and PAI-1 4G/5G genotype combinations associated with high risk and low risk for myocardial infarction from MDR analysis with the lowest prediction error. For each genotype combination, the number of cases is displayed in the left bar while the number of controls is displayed in the right-box. Darker shade indicates the high risk group. Note that the pattern of high and low risk for the ACE polymorphism differs depending on the value of the PAI-1 polymorphism. This is evidence of epistasis or gene-gene interaction.