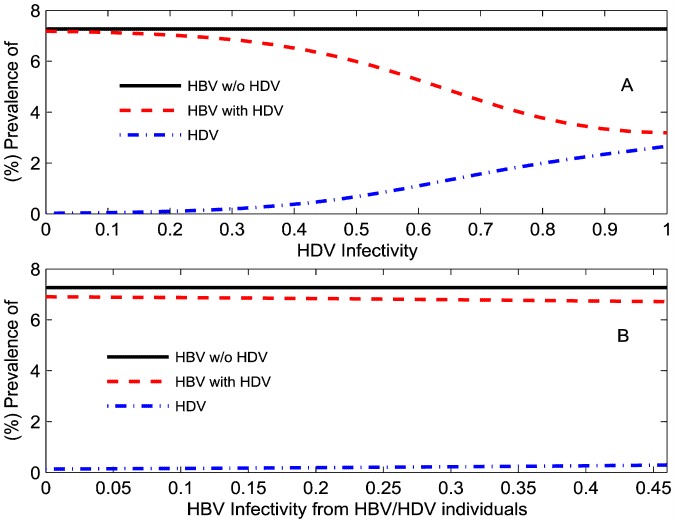
Figure 2. How one virus infectivity impacts the other.
(%) HBV and (%) HDV prevalence in the total population during HBV mono-infection (solid black line) and dual HBV-HDV epidemics (dotted red line and dashed dotted blue line) at  years relative to: (A) values of infectivity of acute HDV infection (
 ) on the x-axis with
  also varying as
  ; (B) levels of suppression by HDV on the transmission of HBV in those dually infected individuals (
 ) on the x-axis with
  also varying as
  .
.

