
Figure 3. Effect of IGE variants on KCC2-mediated Cl− extrusion capacity.
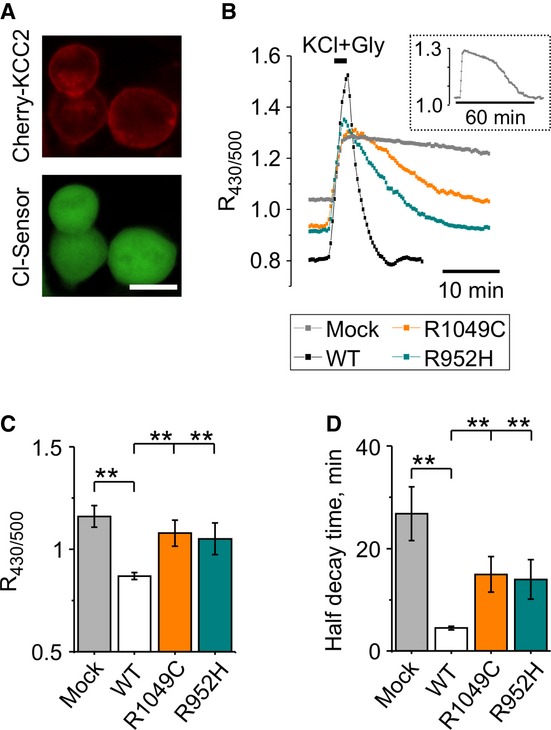
A Fluorescence signals recorded from N2a cells co-transfected with Cl-Sensor (green), GlyR (non-fluorescent), and mCherry-KCC2 (red, Obj 20×, NA 0.45, 500 nm excitation, scale bar = 20 μm).
B Representative traces of Cl-Sensor fluorescence ratio recording from N2a cells expressing different KCC2 constructs as indicated. Horizontal bar indicates the time of application of 100 mM KCl and 50 μM glycine. The ordinate axis indicates the ratio of Cl-Sensor fluorescence measured at 430 and 500 nm excitation wavelengths (R430/500). The inset illustrates the full record of R430/500 fluorescence from mock-transfected cells shown in the main plot.
C, D Columns show mean ± s.e.m. of the basal R430/500 level (C) and half decay time of Cl− extrusion after glycine + KCl application (D). n = 4 – 7 experiments. **P < 0.01, one-way ANOVA test (See Supplementary Tables S3 and S4 for details).